Fig. 1
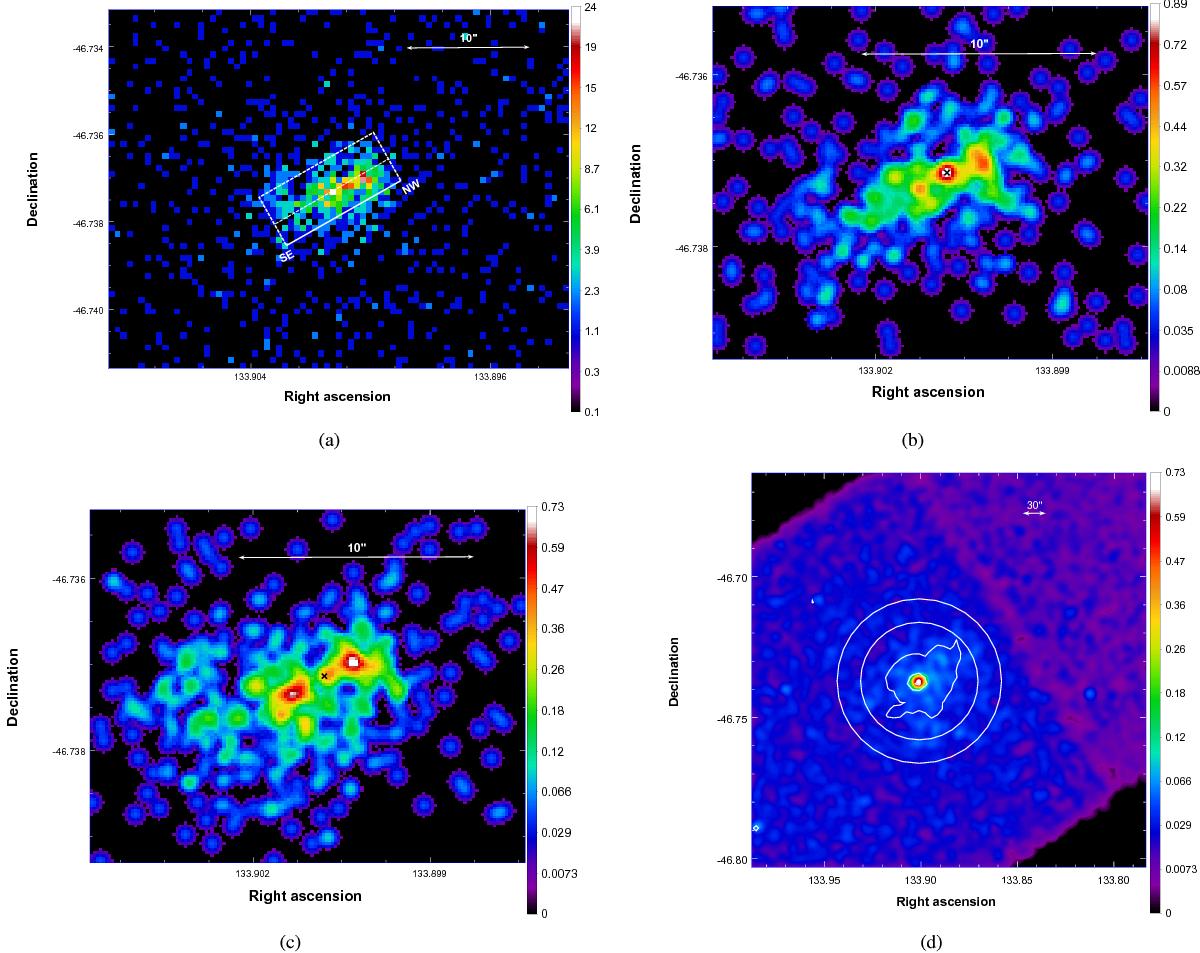
Panel a) Chandra ACIS-S (0.5–8 keV) full-resolution image of the PWN around PSR J0855−4644. The image size is 29′′× 27′′. The box shows the extraction region for the count profile in Fig. 2. The white dashed line inside shows the symmetry axis along which the nebula is extended. Panel b) ACIS-S (0.5–2 keV) sub-pixel image (image size is 18′′× 15′′) produced at ![]() resolution. The black cross denotes the radio position of the pulsar. The image has been smoothed with a 1′′ FWHM Gaussian to emphasize the nebular morphology. Panel c) same as in panel b), but in the energy range of 2–8 keV. Panel d) larger 2–8 keV image centred on PSR J0855−4644 (ACIS-S3 CCD) smoothed with a Gaussian of 10′′. Overlayed are contours from the XMM image (Fig. 2 of Acero et al. 2013) at level values of 1.13, 6.0, and 14.1 counts arcsecs-2. The annular region used for the background spectral extraction (inner radius 75′′) is shown by white solid lines. In all the panels, the colour bar indicates the square root of number of counts, the X and Y axes in degrees, and units are counts for all the images.
resolution. The black cross denotes the radio position of the pulsar. The image has been smoothed with a 1′′ FWHM Gaussian to emphasize the nebular morphology. Panel c) same as in panel b), but in the energy range of 2–8 keV. Panel d) larger 2–8 keV image centred on PSR J0855−4644 (ACIS-S3 CCD) smoothed with a Gaussian of 10′′. Overlayed are contours from the XMM image (Fig. 2 of Acero et al. 2013) at level values of 1.13, 6.0, and 14.1 counts arcsecs-2. The annular region used for the background spectral extraction (inner radius 75′′) is shown by white solid lines. In all the panels, the colour bar indicates the square root of number of counts, the X and Y axes in degrees, and units are counts for all the images.
Current usage metrics show cumulative count of Article Views (full-text article views including HTML views, PDF and ePub downloads, according to the available data) and Abstracts Views on Vision4Press platform.
Data correspond to usage on the plateform after 2015. The current usage metrics is available 48-96 hours after online publication and is updated daily on week days.
Initial download of the metrics may take a while.