Fig. 3
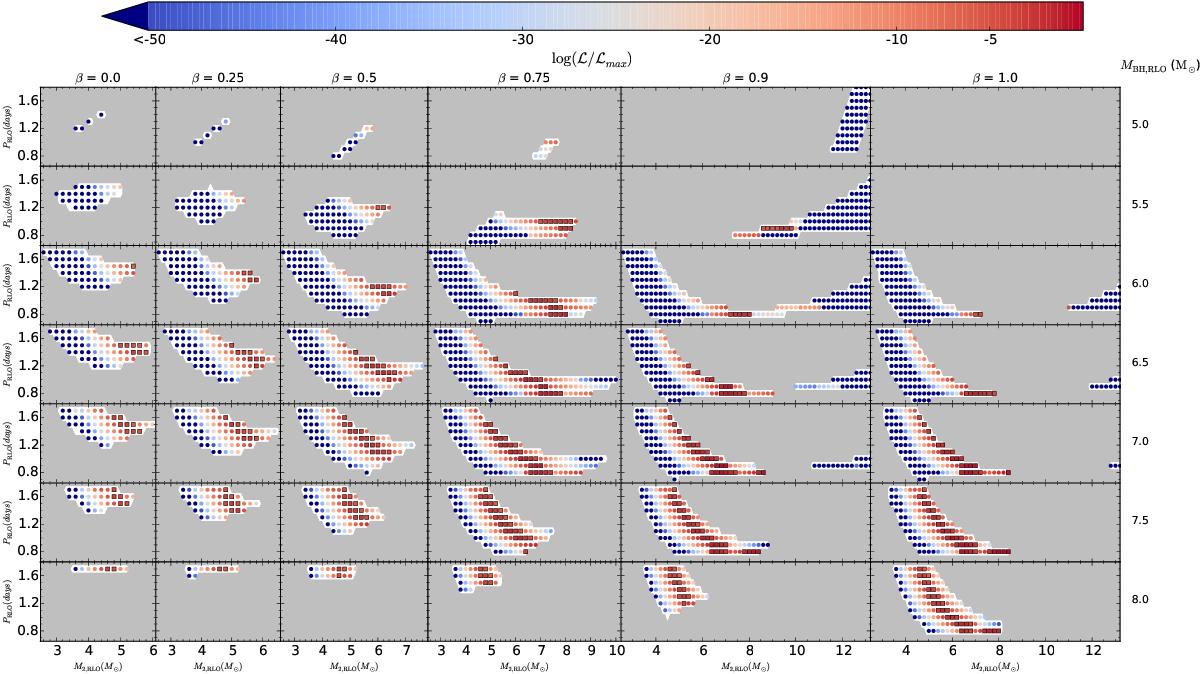
Grid of MT sequences for different MT efficiencies of α = 0.0 and β = [0.0, 0.25, 0.5, 0.75, 0.90, and 1.0], from the left to the right columns of the panels. Each row, as labeled at the right of the figure, corresponds to an initial value of MBH,RLO = [5.0, 5.5, 6.0, 6.5, 7.0, 7.5, and 8.0] M⊙. On the x-axis of each panel are shown the initial mass of the donor star M2,RLO, the range of which is allowed to vary with β. The y-axis shows the initial orbital period PRLO in days. Gray areas correspond to regions with initial MBH,RLO, M2,RLO, and PRLO values that do not pass the analytic MT test or the initial ZAMS radius is greater than the Roche lobe. The white areas represent initial combinations of MBH,RLO, M2,RLO, and PRLO that pass the analytic MT model, and for which we have made a detailed simulation with MESA. Circles indicate MT sequences that fail check 4, squares pass all checks and are persistent solutions according to Eq. (13). The colors indicate the relative likelihood of each detailed run.
Current usage metrics show cumulative count of Article Views (full-text article views including HTML views, PDF and ePub downloads, according to the available data) and Abstracts Views on Vision4Press platform.
Data correspond to usage on the plateform after 2015. The current usage metrics is available 48-96 hours after online publication and is updated daily on week days.
Initial download of the metrics may take a while.