Fig. 2
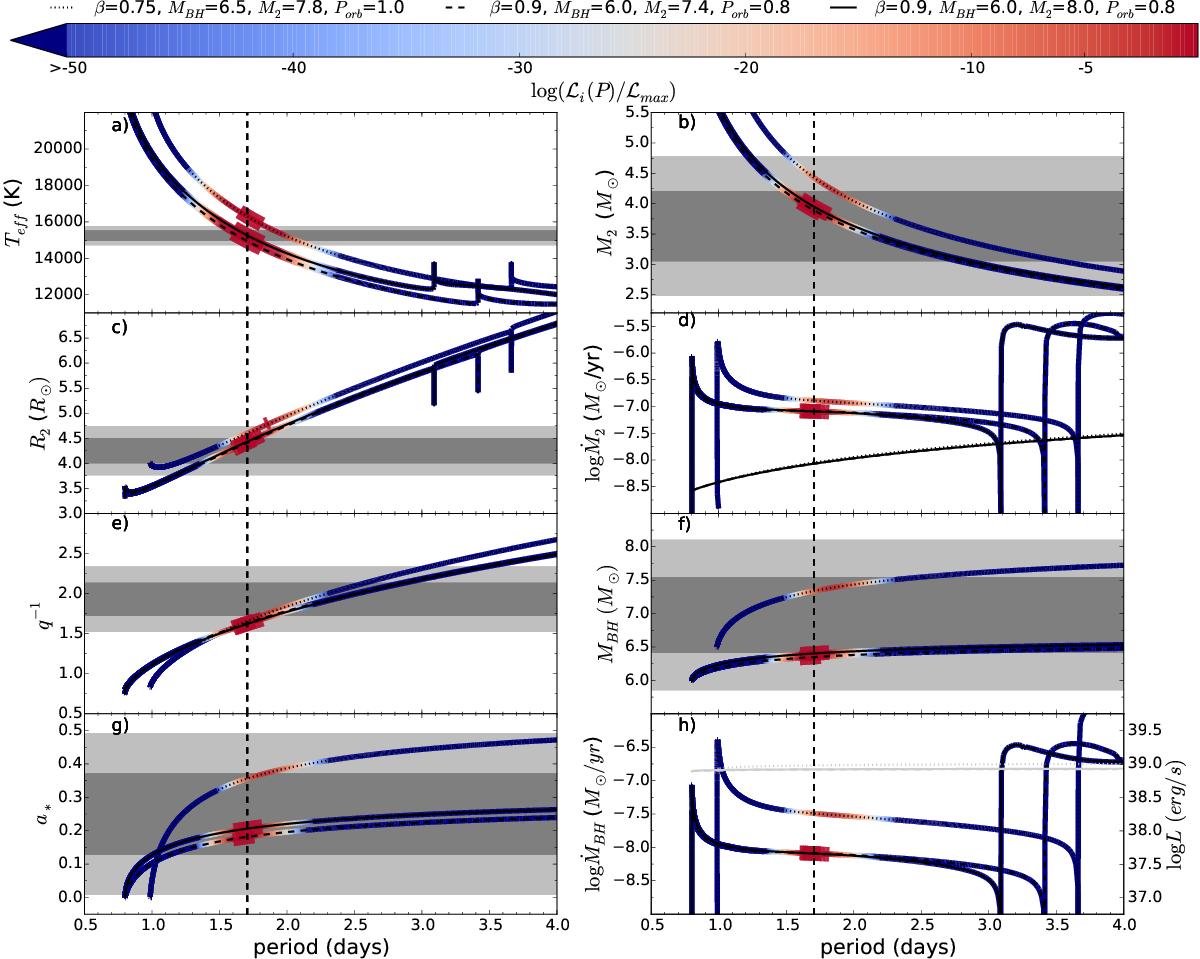
Solid, dashed, and dotted lines represent examples of a binary system undergoing RLO and MT for different sets of initial values at the onset of RLO. The vertical dashed line is the observed orbital period given in Table 1. The color map indicates the relative likelihood log (ℒi/ ℒmax) from Eq. (14). The thickening of the color bands around the observed orbital period denotes that in this region all model parameters ℐi,j, different from the one being plotted, are within 2σ of the observed value from Table 1. In all panels but f) and h), the dark and light gray regions are centered on the observed value, and each gray contrast extends to an area of ±1σ and ±2σ, respectively. The black lines in panel d) are the critical MT rate, Eq. (13). The light gray lines in panel h) are the Eddington accretion rate (Frank et al. 2002). We note that all three examples displays first a case A MT where core-hydrogen burning takes place. The sudden changes seen at periods equal to 3.1, 3.4, and 3.7 days are the transition from case A MT to case B MT, where the donor star has formed a helium core and hydrogen-shell burning has commenced. Computation of the three examples shown are stopped before case B MT is completed, when the orbital period reaches six days.
Current usage metrics show cumulative count of Article Views (full-text article views including HTML views, PDF and ePub downloads, according to the available data) and Abstracts Views on Vision4Press platform.
Data correspond to usage on the plateform after 2015. The current usage metrics is available 48-96 hours after online publication and is updated daily on week days.
Initial download of the metrics may take a while.