| Issue |
A&A
Volume 596, December 2016
|
|
|---|---|---|
| Article Number | A38 | |
| Number of page(s) | 10 | |
| Section | Interstellar and circumstellar matter | |
| DOI | https://doi.org/10.1051/0004-6361/201629607 | |
| Published online | 25 November 2016 | |
Violent environment of the inner disk of RW Aurigae A probed by the 2010 and 2015 dimming events⋆
1 Max-Planck-Institut für Extraterrestrische Physik, Giessenbachstrasse 1, 85748 Garching, Germany
e-mail: This email address is being protected from spambots. You need JavaScript enabled to view it.
2 Institute of Astronomy, Madingley Rd, Cambridge, CB3 0HA, UK
3 Scientific Support Office, Directorate of Science, European Space Research and Technology Centre (ESA/ESTEC), Keplerlaan 1, 2201 AZ Noordwijk, The Netherlands
4 UJF-Grenoble 1/CNRS-INSU, Institut de Planétologie et d’Astrophysique de Grenoble (IPAG) UMR 5274, 38041 Grenoble, France
5 Astrophysics Group, Imperial College London, Blackett Laboratory, Prince Consort Road, London SW7 2AZ, UK
Received: 29 August 2016
Accepted: 26 October 2016
Abstract
Aims. The young binary system RW Aur shows strong signatures of a recent tidal encounter between the circumprimary disk and the secondary star. The primary star has recently undergone two major dimming events (Δmag ≈2 in V band) whose origin is still under debate. To shed light on the mechanism leading to the dimming events, we study the extinction properties, accretion variability, and gas kinematics using absorption lines from the material that is obscuring RW Aur A.
Methods. We compared our moderate-resolution X-shooter spectra of the dim state of RW Aur A with other spectral observations. In particular, we analysed archival high-resolution UVES spectra obtained during the bright state of the system to track the evolution of the spectral properties across the second dimming event. Since the X-shooter spectrum is flux calibrated, we provide new synthetic photometry of RW Aur A during the dim state.
Results. The spectrum obtained during the dim state shows narrow absorption lines in the Na and K optical doublets, where the former is saturated. With a velocity of − 60 km s-1, these lines indicate that during the dim state the disk wind is either enhanced or significantly displaced into the line of sight. The photometric evolution across the dimming event shows a grey extinction, and is correlated with a significant reduction of the EW of all photospheric lines. Emission lines that trace accretion do not vary significantly across the dimming.
Conclusions. From comparing our observations with complementary results from the last years, we conclude that the dimming event is related to a major perturbation on the inner disk. We suggest that the inner disk is occulting (most of) the star and thus its photosphere, but does not occult the accretion regions within a few stellar radii. Since observations of the outer disk indicate that the disk is modestly inclined (45–60°), we propose that the inner disk might be warped by an as yet unseen (sub-) stellar companion, which may also explain the 2.77 day periodic variability of the spectral lines.
Key words: protoplanetary disks / binaries: general / pulsars: individual: RW Aurigae / stars: variables: T Tauri, Herbig Ae/Be / accretion, accretion disks
This work is based on observations made with the ESO telescopes at the Paranal Observatory under programmes ID 294.C-5047 and 382.C-0711.
© ESO, 2016
1. Introduction
The binary system RW Aur consists of two K-type stars (with masses of 1.4 and 0.9 M⊙, Ghez et al. 1997; Woitas et al. 2001) and has a significantly high ratio of the accretion rate onto the primary star A (2−10×10-7M⊙/yr, Hartigan et al. 1995) to the circumprimary disk mass (~ 10-3M⊙, Andrews & Williams 2005). The system is also known to possess a powerful jet launched from star A (e.g. López-Martín et al. 2003). The secondary star B is located ≈ 1.5″ away from star A (e.g. Cabrit et al. 2006), and the whole system is located at 140 pc from Earth (van Leeuwen 2007). Cabrit et al. (2006) observed a huge tidal tail trailing the primary disk in 12CO rotational emission lines, and they interpreted it as the dynamic signature of a tidal interaction between the circumprimary disk and the secondary star B. This interpretation has been supported by detailed hydrodynamical modelling (Dai et al. 2015), which places the system into the rare category of protoplanetary disk systems observed to be undergoing a dynamical encounter. The gravitational disturbance might be the cause of the high accretion rate, since tidal encounters can remove angular momentum from the inner regions of the disk (e.g. Clarke & Pringle 1993; Ostriker 1994).
RW Aur A has recently undergone two major dimming events (Rodriguez et al. 2013; Petrov et al. 2015). The first one lasted for ~ 180 days, with a dimming of 1.5−2 mag in the V band (Rodriguez et al. 2013). The second dimming event started before October 2014 (and ended in August 2016 Bozhinova et al. 2016), with an even deeper occultation (ΔV ≳ 2 mag). Photometric studies have shown that during the second dimming event the extinction is nearly grey from optical (Antipin et al. 2015, hereafter A15) to near-infrared (NIR) bands (Schneider et al. 2015b), suggesting that the occulting material has undergone significant grain growth. Moreover, Schneider et al. (2015b) have detected an enhancement in the gas column density along the line of sight to star A during the second dimming event (NH ≈ 2×1022 cm-2) by comparing X-ray observations of RW Aur A during bright and dim states. Finally, Shenavrin et al. (2015) have shown that the second dimming event is correlated to an excess in the NIR (in L and M bands), and they proposed that this excess might be due to an increased emission from hot dust (~ 1000 K) at ~ 0.1 AU, suggesting that the occulting material is associated with the inner regions of the disk. Archival WISE data have confirmed the same observational result (Bozhinova et al. 2016).
To explain the observed dimming events, different models have been invoked. Using hydrodynamical modelling, Dai et al. (2015) have shown that a tidal bridge between the two stars can obscure RW Aur A and that the column density might be sufficient to explain the dimming (as initially proposed by Rodriguez et al. 2013). Petrov et al. (2015) have suggested that the extinction could be due to an outburst of a stellar wind entrapping dust grains of the inner region of the disk. Finally, Schneider et al. (2015b) have proposed that the observations could be explained by geometric variations in the inner disk, similarly to the AA Tau system (e.g. Bouvier et al. 2013), or possibly in the V1184 Tau system (e.g. Giannini et al. 2016). These scenarios are more thoroughly described in Sect. 4.
An insight into the kinematic properties of the occulting material and the accretion rate evolution of star A is essential if we are to determine the physical origin of the dimming event and to distinguish between the possible interpretations reported above. In Sect. 2 of this paper we present new spectral data obtained during the second dimming event with the X-shooter spectrograph mounted on the Very Large Telescope (VLT), together with an analysis of archival VLT/UVES data taken during the system bright state. In Sect. 3 we analyse the observational data and compare the two sets of spectra. In Sect. 4 we discuss the possible interpretations of our and recent observations, and in Sect. 5 we summarise our conclusions.
2. Observations and data reduction
2.1. X-shooter observations
We have obtained new spectra of RW Aur A using the VLT/X-shooter instrument (Vernet et al. 2011) during the night of March 19, 2015 (DDT Pr.Id. 294.C-5047, PI Facchini). At the time of observation the seeing conditions were very good (0.6′′ at zenith, ~0.86′′ at the airmass of the target). A set of large slits (1.6 × 11′′–1.5 × 11′′–1.2 × 11′′ in the UVB, VIS, and NIR arms) and a set of narrow slits (0.5 × 11′′ in the UVB arm, 0.4 × 11′′ in the VIS and NIR arms) were used for the acquisition of the data. The spectra obtained using the large slits have lower spectral resolution but do not suffer slit losses, and are thus absolutely flux calibrated. Conversely, the spectra taken with the narrow slits lead to the highest spectral resolution (R~ 18 000 at λ~ 600 nm), but must be corrected in flux using the data taken with the large slits. The observing strategy we adopted consisted of a short exposure (70 s, 45 s, and 45 s in each arm) in stare mode with the large slit, followed by a complete ABBA nodding cycle with the narrow slits with exposures 160 s, 70 s, and 80 s in each arm at any nodding position, and finally another short stare exposure (50 s, 30 s, and 35 s in each arm) with the large slit again. This procedure was repeated twice. We emphasise that star B lay out of the slit in all our observations.
The spectra were reduced using the standard ESO pipeline for X-shooter (Modigliani et al. 2010) version 2.5.2 with the same procedure as in Manara et al. (2013). The reduction was carried out independently for each arm, and the flux calibration in the pipeline was performed using the flux standard star observed during the night. Each 1D extracted spectrum obtained with the pipeline was corrected for telluric using a standard telluric spectrum obtained at similar airmass conditions as the target and with slits with the same width. Then, the two narrow-slit spectra taken successively were co-added to enhance the signal-to-noise ratio (S/N). Finally, the combined narrow-slit spectra were rescaled to the large-slit spectra to correct for slit losses. The final spectra cover the wavelength region from λ~ 320 nm to λ~ 2500 nm with a resolution R~ 10 000 of up to λ~ 550 nm and from λ~ 1000 nm, and R~ 18 200 in between. The entire X-shooter spectrum is shown in Fig. 1.
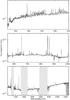 |
Fig. 1 X-shooter flux-calibrated spectrum of RW Aur A after telluric correction. The grey regions are dominated by atmospheric absorption. |
2.2. UVES observations
In the next sections we compare spectral features of the dimmed state from the X-shooter spectrum with previous higher resolution UVES (Dekker et al. 2000) spectra of RW Aur A obtained during its bright state between 2008 and 2010 (Pr.Id. 382.C-0711, PI Whelan). The dates of the UVES observations are reported in Table 1. These data were obtained using 0.6′′ wide slits, leading to a resolution R~ 70 000. The spectra are divided into three arms, the blue arm covering the wavelength range λλ 376−498 nm, and the red arms covering the range from λ~ 498 nm to λ~ 700 nm when the central wavelength was set to 600 nm, or from λ~ 670 nm to λ~ 1042 nm with central wavelength 860 nm. In both cases a gap of ~8 nm centred on the central wavelength is present in the red arm spectra.
The reduction was carried out with the standard ESO pipeline for UVES version 5.7.0. The output of the pipeline is the extracted 1D spectrum, which is also flux calibrated in the blue arm and in the red arm when the central wavelength is 860 nm. However, this flux calibration is obtained using the standard response curve and does not account for slit losses, so the absolute flux calibration may be incorrect. We therefore subsequently only use the shape of the emission and absorption lines from the UVES data, not the fluxes. Finally, no correction for telluric lines was performed on these UVES spectra.
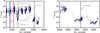 |
Fig. 2 Left panel: light curve in V-band of the unresolved RW Aur system from the AAVSO database. The solid vertical lines show the dates when the UVES and X-shooter (black) spectra were taken (colour legend for UVES spectra is in Table 1). The dashed vertical lines show the dates of the four optical spectra by Chou et al. (2013), which overlap on the used scale. The brown and grey dashed-dotted lines show the dates of the two UV HST spectra by France et al. (2012, 2014, respectively). Right panel: same as in left panel, zoomed during the second dimming event. Data in both panels are from Kafka (2016). |
Dates of the UVES and X-shooter spectra analysed in this work.
3. Results
The epochs of our RW Aur A observations are compared against the system light curve in Fig. 2. Our X-shooter data are taken well into the second dimming event. Since RW Aur A has been spectrally monitored at different wavelengths in the past decade, in particular in the optical (Alencar et al. 2005; Chou et al. 2013; Petrov et al. 2015; Takami et al. 2016) and in the UV (France et al. 2012, 2014; McJunkin et al. 2013), we can compare our observations with different datasets, obtained in both the bright and the dim states. In particular, we consider the following observables:
-
1.
photometry and light curve of RW Aur A and B, to analyse theextinction properties of the occulting material;
-
2.
atomic absorption lines against the stellar emission, to try to constrain the gas column density in front of the star, and obtain kinematic information on the gas lying along the line of sight;
-
3.
photospheric absorption lines, to check whether the veiling has changed during the dimming;
-
4.
accretion signatures in emission lines, to verify whether accretion properties have evolved significantly across the dimming events.
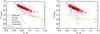 |
Fig. 3 Left panel: photometry of the unresolved RW Aur system A (data from Grankin et al. 2007; Petrov et al. 2015); the red arrow shows the reddening vector for typical ISM-like dust, for AV = 1 (Mathis et al. 1977). Right panel: photometry of star A after subtraction of the averaged flux of star B (taken from White & Ghez 2001; Antipin et al. 2015) from the unresolved photometry. Legend: red dots are historical data from 1986 to 2005. Blue hexagons: first dimming. Black triangles: between the two dimming events. Orange pentagons: second dimming. Green star and green triangle: photometry of stars A and B, respectively, from A15. Brown triangle: star B from WG01. Magenta star: star A from our X-shooter spectrum. All points are in the Johnson system (Johnson & Morgan 1953). |
3.1. Photometric evolution of RW Aur
RW Aur optical (UBVRI-bands) photometry has been monitored intensively for many decades now (e.g. Petrov et al. 2001b, 2015; Rodriguez et al. 2013, 2016). However, very few of these photometrical measurements have resolved the two binary components. Since the primary star is significantly more massive, the optical photometry is usually dominated by it, and is thus sufficient to determine the occurrence of the dimming events. However, during the dimming events, star A can be dimmed by > 2 mag, and the unresolved optical photometry can be dominated by star B (as has been noted by Schneider et al. 2015b). Since the X-shooter spectra are flux calibrated and have only star A in the aperture, we can compute the synthetic optical photometry of the primary star on the date of the X-shooter observations, thus checking how the colours and the magnitudes have evolved for star A from the bright to the faint state. The magnitudes of the UBVRI-bands are reported in Table 2 in the Johnson system (Johnson & Morgan 1953).
In the literature, only two resolved photometric datasets of stars A and B are reported (White & Ghez 2001; Antipin et al. 2015). The first one was taken when RW Aur A had not shown any dimming event yet, whereas the second was taken during the second dimming event. We note that Schneider et al. (2015b) have also obtained resolved NIR photometry (JHK bands) during the second dimming event.
We then considered archival photometric data from Grankin et al. (2007; from 1986 to 2005) and from Petrov et al. (2015; from November 8, 2011), where the system is unresolved. To reconstruct the photometric evolution of star A, we considered all the photometric points of the unresolved system, and we subtracted the flux of star B from them, assuming that it is stable with time. In Fig. 3 we show the photometry of the whole system (left panel), and the photometry of star A after subtraction of the flux of star B, which was calculated as the average of the estimates by White & Ghez (2001) and Antipin et al. (2015, right panel). When star A is bright, the photometry does not change substantially, since star A dominates the flux of the system in the optical bands. The photometry of the two dimming events moves substantially in the V, V−R colour–magnitude diagram when we subtract the contribution from star B, and they become statistically similar to the two resolved photometric points of star A taken during the dimming. The large scatter in the corrected photometry traces the uncertainty on the unresolved photometry.
During the dimming events, while being about 3 mag fainter, the primary star retains the same colour range, that is, the extinction law is roughly grey in the optical bands, as suggested by Antipin et al. (2015) and confirmed by Schneider et al. (2015b) in JHK bands. We thus confirm this result with the resolved photometry from our X-shooter spectrum and by subtracting the flux of star B from unresolved archival photometry. Moreover, we observe that the extinction is likely also grey during the dimming events, while it is compatible with interstellar medium (ISM) extinction when the star is bright, with AV ~ 1 (Petrov et al. 2001b).
3.2. Atomic absorption lines against the stellar emission
In the X-shooter spectrum we clearly detect a narrow absorption component in the resonant Na i D (at λ ~ 590 nm) and K i D (at λ ~ 765 and 770 nm) lines (see Fig. 4). This narrow absorption component probes gaseous material along the line of sight.
3.2.1. Equivalent widths and column densities
For the Na doublet, we estimated the equivalent width (EW) of the narrow absorption feature assuming a Gaussian absorption for the broad hot component (Fig. 4, top panel). We obtain an EW of ~ 0.3−0.6 Å for the two Na narrow lines (depending on the modelling of the emission line), and of ~ 0.2 Å for the two K lines. Petrov et al. (2015) searched for narrow absorption signatures in the same Na lines, but they did not detect them, either because of a too low spectral resolution (they are sensitive to EW>0.2 Å), or because of the intrinsic time variability of the physical phenomenon.
The fact that we obtain the same EW for both Na i D lines (see Fig. 4) indicates that the lines are saturated. The absorption oscillation strength f of the two hyperfine transitions differs by a factor of 2 (e.g. Morton & Smith 1973). By converting the EW of the Na i D1 line at 589.75 nm (where the absorption oscillation strength is half the strength of the Na i D2 line) into column density, we obtain a lower limit on the column density of atomic neutral sodium of ~ 3−6×1012 cm-2. This value is a typical column density where the line saturates in ISM measurements (e.g. Crutcher 1975). The same procedure can be applied to the K i D1 line, where we obtain ~ 1012 cm-2 as a lower limit on the column density of atomic neutral potassium. For the K doublet, the moderate spectral resolution cannot discern whether the lines are saturated. We also searched for absorption lines at the sodium and potassium ultraviolet doublets at 3300 and 4045 Å. These doublets are often used to determine the column density in the ISM when the Na i D lines are saturated (e.g. Crutcher 1975), since the absorption oscillation strengths are lower by a factor of ~ 10−100 (e.g. Morton & Smith 1973). However, we did not detect these absorption lines. As a result of the strong accretion signatures and the poorer spectral resolution in the UVB arm, we have a detection limit of absorption lines with EW≲0.27 Å. This yields an upper limit on the column density of neutral atomic sodium of ~ 2×1014 cm-2.
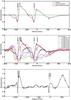 |
Fig. 4 Top panel: Na i D lines from X-shooter. Central panel: Na i D lines from X-shooter and UVES before the dimming events. Bottom panel: K i D lines from X-shooter. All the velocities are heliocentric. |
3.2.2. Line profiles
Gahm et al. (1999) estimated the radial velocity (RV) of star A as v0 = 15.87 ± 0.55 km s-1. Recent studies are in agreement with this estimate (Folha & Emerson 2001; Takami et al. 2016). We note that the heliocentric velocity oscillates by ± 5−6 km s-1 (Gahm et al. 1999; Petrov et al. 2001a; Takami et al. 2016), and Petrov et al. (2001a) noted that these variations are periodic (with a period of 2.77 days). We took this value of RV into account to derive the velocity relative to the star of the Na and K lines in our spectra. We obtain that the former is − 60 ± 10 km s-1, while the latter is − 51 ± 10 km s-1 (see Fig. 4), where the uncertainties are dominated by the S/N. These absorption lines are thus probing moderately blueshifted material. Both lines are likely tracing the same material, since they have a compatible velocity.
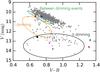 |
Fig. 5 Photometry of star A, as in the right panel of Fig. 3. Legend: grey dots are historical data from 1986 to 2005. Grey hexagons: first dimming. Grey triangles: between the two dimming events. Grey pentagons: second dimming. Green star and green triangle: photometry of stars A and B, respectively, from A15. Brown triangle: star B from WG01. Magenta star: star A from our X-shooter spectrum. All points are in the Johnson system. The coloured filled circles show photometric points closer than two days to the spectrographic observations with UVES and X-shooter. The colour code is reported in Table 1. |
We then studied the Na i D line profiles of the eight high-resolution UVES spectra of RW Aur A (see central panel of Fig. 4). They are broader and significantly different from the line profile obtained with X-shooter. In particular, there is much less redshifted absorption (from 0 to + 200 km s-1) in the X-shooter data than in (most of) the UVES data, which suggests either that the mass accretion rate has decreased in the X-shooter data or that the accretion region is now partly occulted. Another main difference is the high-velocity blueshifted absorption (from about − 100 km s-1 to about − 200 km s-1) seen in the X-shooter spectrum that is not seen earlier, which suggests the development of a fast wind. The 2010 UVES spectrum is the most similar to the X-shooter one, with a typical P Cyg profile. Only this UVES spectrum shows a clear absorption component at ~− 60 km s-1 (see Fig. 4, central panel). During this epoch, the Na i D doublet appears not to be saturated. We note, however, that in the colour–magnitude diagram (Fig. 5) this spectrum seems to be correlated with a minor dimming event. A similar feature was also observed in some older spectra, such as those shown in Fig. 2 of Alencar et al. (2005). The same velocities (~− 60 km s-1) in absorption have also been observed in Ca ii lines at the beginning of the first dimming event in 2010 by Chou et al. (2013). Interestingly, Chou et al. (2013) obtained four different spectra during the ingress time of the first dimming event. It is apparent that there is a very fast transition from a line profile similar to those in the UVES spectra presented here, and a line profile that closely resembles our X-shooter profile. Similar moderately blueshifted lines at ~− 60 km s-1 have also been observed by Petrov et al. (2015) in the K optical doublet and by France et al. (2014) in low-ionisation UV lines. All these observations suggest that during the bright state the lines are dominated by accretion properties, whereas during the dim states they are dominated by wind features.
3.2.3. Narrow co-moving component
In all the UVES spectra of the Na i D lines we observe a much narrower unsaturated absorption component (barely detected by X-shooter) at ~− 2 km s-1 relatively to star A (see central panel of Fig. 4). This absorbing material is consistent with moving coherently with star A (within the uncertainty on the estimate of the velocity of the star). These lines are unlikely to be photospheric, since they are very narrow. They present an EW of ~ 0.017 Å and ~ 0.030 Å in the red and blue component, respectively, indicating a neutral sodium column density of ~ 1.7×1011 cm-2. These velocities and equivalent widths are in agreement with the Na absorption lines caused by the atomic cloud surrounding the Taurus-Aurigae star-forming region (Pascucci et al. 2015).
3.3. Veiling (?) of photospheric absorption lines
We have three strong photospheric lines in the X-shooter and in the UVES spectra: two Ca i lines (at 610.27 and 612.22 nm), and the Li line at 670.78 nm (see Fig. 6). By comparing the UVES and X-shooter lines, we clearly see that the EW of these photospheric lines during the dimming event decreases strongly. This confirms the result by Takami et al. (2016), who have observed the same trend on a large number of epochs. The 2010 (red) UVES spectrum again resembles the spectrum of X-shooter, suggesting that whatever is causing the spectral changes related to the dimming event might be an extreme state of a more frequent phenomenon.
3.4. Emission lines and accretion luminosity
The high accretion rate of RW Aur A causes a plethora of strong emission lines related to the accretion process. Many of these are within the wavelength range covered by the X-shooter spectrum (e.g. Alcalá et al. 2014). In particular, we consider in the following the Hα, Hβ, Hγ, Hδ, Paβ, Paγ, Paδ, Brγ, Ca ii K, the Ca ii IR triplet, and He i at 587 and 667 nm lines to derive an estimate of the accretion rate during the dimming.
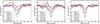 |
Fig. 6 Photospheric absorption lines of Ca i at 610.27 and 612.22 nm (left and central panel, respectively) and Li at 670.78 nm (right panel). |
3.4.1. Accretion luminosity
The X-shooter spectrum we obtained was flux calibrated, and the observed flux of the emission lines was then obtained by direct integration of the continuum-subtracted spectrum across the line. This was converted into observed line luminosity ( ) using the distance of 140 pc to RW Aur A. Using the relations between line luminosity and accretion luminosity by Alcalá et al. (2014), we obtain the apparent accretion luminosity
  . This is shown for each line in Fig. 7, where the lines are ordered according to their central wavelengths. We refer to this quantity as apparent luminosity since we have not corrected for extinction, as we discuss in the following. The apparent accretion luminosity as derived from the Balmer lines is much lower than the luminosity obtained from the Paschen lines. Although the sign of this variation is consistent with the sign generated by dust extinction, this interpretation is inconsistent with the fact that the photometric colours indicate grey extinction up to the K band (Antipin et al. 2015; Schneider et al. 2015b). Moreover, the large scatter of ~ 1 dex between measured from lines located close in wavelengths, such as Ca ii K and Hβ, is too large to be simply ascribed to differential extinction. Instead, Fig. 7 is most readily explicable in terms of gas absorption, which would predict stronger attenuation of the Balmer series than the Paschen lines.
We now consider a grey extinction of AV = 3 mag (Schneider et al. 2015b) to recover the actual accretion luminosity Lacc. We use the following stellar parameters: M∗ = 1.4 M⊙, R∗ = 1.6 R⊙, and log Teff = 3.67 (Rodriguez et al. 2013, and references therein). If we do not take into account the Balmer lines and average across all the other lines, we obtain a mass accretion rate Ṁ ≈ 4×10⁻⁸M⊙/yr, in agreement with the estimate of 2 × 10⁻⁸M⊙/yr by Ingleby et al. (2013, since accretion rates are considered to be accurate to within a factor of two, and these authors used a different method to estimate the accretion rate, namely NUV and optical excess and a template stellar spectrum). The accretion rate is much lower than the rate obtained by Hartigan et al. (1995; ~ 10-6M⊙/yr), but we note that they used different stellar parameters (a larger and less massive star), which would yield an accretion rate of ~ 2×10⁻⁷M⊙/yr from our accretion luminosity. However, we cannot necessarily conclude that the accretion rate has decreased since the 1990s, since the lines used in our estimate (i.e. all those in Fig. 7 except for the Balmer lines) might also be affected by gas absorption.
3.4.2. He I emission line at 587 nm
We analyse the profile of the He i line at 587 nm in more detail. This line is also present in the UVES spectra. The continuum-subtracted peak-normalised profiles of the line are shown in Fig. 8. The line width is relatively steady across the dimming event. This is also observed in the Hα emission line. The only exception is the 2010 UVES case (and marginally in the X-shooter one), which shows enhanced emission at − 60 km s-1 in the heliocentric reference frame. We note that an emission feature at the same velocities is also observed in the Ca i lines shown in Fig. 6. The relatively steady width of this line suggests that the accretion rate has not significantly increased during the dimming event. In particular, the variations seen in the broad component of the 2010 UVES and in the X-shooter spectra are likely due to an enhanced hot wind (Beristain et al. 2001; Kwan & Fischer 2011), whereas the narrow component tracing accretion does not seem to be affected by the dimming.
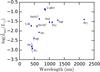 |
Fig. 7 Apparent accretion luminosities (accretion luminosities not corrected for extinction) from various emission lines labelled in the plot. The relations between |
4. Discussion
The peculiar photometric and spectroscopic behaviour of RW Aur A has led to different interpretations of its variable nature, and in particular of its dimming events. Here we analyse the possibilities presented in the literature, and compare how the spectra presented here either confirm or discard these hypotheses. We finally propose a new interpretation.
4.1. Tidally disrupted material
Soon after the discovery of the first dimming event, Rodriguez et al. (2013) interpreted the drop in optical flux as due to the outer disk being partially disrupted by the outer binary. Dai et al. (2015) analysed the primary disk properties and the proper motions of RW Aur A and B in detail, concluding that the system is well represented by a parabolic tidal encounter between the primary disk and star B. Furthermore, they showed that with such dynamics, part of the disrupted disk would form a bridge structure between the two stars, and that it would precess across the line of sight to star A, thus leading to dimming events. Finally, Rodriguez et al. (2016) interpreted the observed colour evolution during the ingress time of the dimming events as a sign of dust segregation within the occulting body.
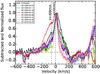 |
Fig. 8 Continuum-subtracted and normalised emission lines of He i at 587.56 nm in the heliocentric reference frame. |
However, two observations suggest that this theory does not explain the recent dimmings. First, as mentioned in Sect. 1, the optical and NIR dimmings, observed to be grey up to ~ K band, show a strong correlation with IR excess emission in L and M bands (Shenavrin et al. 2015; Bozhinova et al. 2016), compatible with black-body emission at ~ 1000 K, thus with dust thermal emission at ~ 0.1 AU from the central star. This IR excess indicates that the dimming is correlated to some major perturbation of the inner disk. Moreover, the hydrodynamical simulations by Dai et al. (2015) indicate that the material predicted to lie close to the line of sight to star A has a heliocentric RV between − 8 and 0 km s-1. The increase in dust column density would be correlated to an increase in gas column density, since the dynamics of the encounter is mainly ballistic (Dai et al. 2015). However, in our X-shooter spectrum we do not observe any increase in the gas column density at such low velocities (see the Na and K absorption lines in Fig. 4).
From the IR excess, we can conclude that the occulting material is very close to the central star (Shenavrin et al. 2015). Moreover, the lower apparent accretion luminosities derived for the Balmer lines compared to other lines tracing accretion indicate that gaseous material is obscuring the accretion regions. Petrov et al. (2015), Takami et al. (2016) suggested that [O i] and [S ii] forbidden lines do not seem to change substantially in total flux between the bright and dim state, indicating that winds and jets on larger scales are not significantly affected by the obscuration, therefore limiting the spatial extent of the occulting material.
4.2. Dust-laden stellar wind
Petrov et al. (2015) and Shenavrin et al. (2015) interpreted the dimming events as caused by dust-laden stellar wind, that is, by a strong stellar wind eroding the inner dusty disk, and dragging dust grains as large as ~ 1 μm along the line of sight. These large sizes are required to reproduce the grey extinction in the optical and NIR bands. In this scenario, the occultation would be a consequence of a stellar outburst; the brightening of the system at L and M bands could then plausibly be ascribed to an episode of enhanced accretion that may trigger an episode of enhanced outflow (e.g. Stepanovs et al. 2014). However, our observations do not indicate a significant accretion variation between the faint and bright periods. In particular, the He i and Hα emission lines do not show significant variation in their profiles. Takami et al. (2016) suggested that new estimates of the mass flux within the jet might be a stronger indication of whether such a stellar outburst has indeed occurred. With the available observations, it seems difficult to either confirm or discard this hypothesis.
4.3. Warped and puffed up inner disk
Another possibility, which we prefer based on available data, is that the enhancement of L and M band emission (Shenavrin et al. 2015) is due not to an accretion burst, but to a reconfiguration of the inner disk, associated with an enhancement of the disk wind signatures (see also Bozhinova et al. 2016). A puffing up of the inner disk would increase the solid angle of dusty material subtended at the star and so enhance the re-radiated infrared flux without the need to invoke an episode of enhanced accretion. It is notable that the likely location of the material emitting in the L and M band is at ~ 0.1 AU, where the dynamical timescale is of the order of a few days, comparable with the timescale for the onset of the optical dimming. If the disk is suitably aligned with respect to the observer’s line of sight, this puffing up of the inner disk (possibly due to hydrodynamical instabilities triggered by the tidal encounter, or due to an interaction between the stellar wind and the inner disk) could also occult the star and X-ray emitting region, reducing the optical flux and accounting for the high gas column detected in the X-ray spectrum (Schneider et al. 2015b). At minimum light, the residual optical flux could be dominated by scattered photons from the vicinity of the stellar polar caps and thus yield a nearly continuous spectrum, consistent with the loss of photospheric absorption features noted by Takami et al. (2016) and in Sect. 3.3 of this paper during the dimming events. The polar caps are expected to be characterised by very high effective temperature in the magnetospheric accretion scenario (with Teff ≳ 10 000 K, much hotter than the rest of the photosphere), thus leading to more pronounced veiling. Another possibility is that during the photometric minima, the photospheric lines are veiled by the corresponding emission lines from the circumstellar material (e.g. the observed jet), as has been directly observed in the UX Ori type star RR Tau (Rodgers et al. 2002). If the puffing up of the disk is associated with enhanced mass loading of the disk wind, then this also naturally explains the appearance of strong absorption features at − 60 km s-1. However, the lack of correlation between the appearance of the disk wind signatures and the accretion properties of the star may be indicating that the wind does not exhibit an actual enhanced mass-loss rate (see also the discussion in Bozhinova et al. 2016), but the puffed-up inner rim has simply displaced the base of the flow closer along the line of sight, thus yielding the blueshifted absorption for geometrical meanings. We observe the − 60 km s-1 feature in absorption in the Na and K optical doublets (Fig. 4) and in emission in the He i line (Fig. 8). The same wind velocities have been observed in the 2013 HST data by France et al. (2014, when RW Aur was between the two dimming events), who clearly illustrated the presence of a low-ionisation wind between − 80 and − 30 km s-1 in absorption lines of N i, Si ii, and Si iii. In this work, we have provided an upper and a lower limit for the column density of this wind in atomic sodium. It is notable that the observed velocities of absorption features are of the order of the escape velocity at ~ 0.1 AU: these velocities exceed those of thermally driven disk winds and point instead to a magnetically driven wind for which the flow velocity is of the order of the local escape velocity.
This scenario requires that the disk is seen close to edge-on, a possibility discarded by Rodriguez et al. (2013) based on the inclination of the outer disk (45−60°), as estimated from mm interferometric observations (Cabrit et al. 2006). However, NIR interferometric observations by Eisner et al. (2007) found the inner disk to be more inclined (77°). Moreover, McJunkin et al. (2013) estimated the inner disk inclination to be > 60°, based on the observation of CO absorption lines in their UV spectra. The inconsistency between these inclinations might come from a warped inner disk, as noted also by Bozhinova et al. (2016). If this is the case, a puffed-up inner disk could lie along the line of sight and occult the primary star. Moreover, the puffed-up ring would intercept more stellar photons and re-radiate them at the local temperature, thus explaining the IR excess observed by Shenavrin et al. (2015). A magnetically driven warp (Foucart & Lai 2011), as in the case of AA Tau (e.g. Bouvier et al. 2007; Cox et al. 2013), is unlikely to occur for a 1.4 M⊙ star, since the magnetic dipole moment is expected to decrease steeply with mass in post-main-sequence (PMS) stars (e.g. Gregory et al. 2012). A warped structure could be produced by a close spectroscopic binary misaligned to the outer disk (e.g. Facchini et al. 2013, 2014). Such a binary has been proposed by Petrov et al. (2001b) to model a 2.77-day variability observed in some emission line profiles (even though this hypothesis has been contested by other authors, e.g. Dodin et al. 2012). We note that warped inner disks caused by the secular interaction with a (sub-) stellar companion are now observed, for example in the HD 142527 system (Marino et al. 2015; Casassus et al. 2015). Moreover, other systems with a low inclination or almost face-on outer disks are now showing minor dimming events (Ansdell et al. 2016; Scaringi et al. 2016). However, the origin of these dimmings might be different from the dimming of RW Aur A.
This scenario of a puffed-up inner disk (and possibly enhanced wind mass-loss) can qualitatively account for the optical dimming, enhanced gas column, and blueshifted absorption features in atomic lines, as well as for the loss of photospheric absorption features during dimming events. In this scenario the lack of significant colour variations then results from a coincidental combination of the effect of reddening on an intrinsically blue-scattered light spectrum.
As mentioned in Sect. 3.2.2, Chou et al. (2013) serendipitously obtained four different spectra of the system during the ingress time of the 2010 dimming event (see Fig. 2), with 2−3 days separation from one spectrum to another. The first two spectra are similar to our UVES spectra, whereas the second two are very similar to the X-shooter one. The fact that the dimming starts before the spectral variations suggests that the disk’s geometrical changes give rise to either an enhancement of the wind mass-loss rate, or simply a geometrical displacement of the base of the disk wind against the spectral continuum. The lag in wind response is of the order of the local dynamical time, as expected for a magnetically driven disk wind.
If the occulting material in the inner disk only obscures the central star, then the optical signal observed during the dimming is mainly scattered by such material. As scattered light has an increased polarisation signature, this scenario could be confirmed by measuring an enhancement of the amount of polarisation with respect to observations taken before the first dimming (Vink et al. 2005). A similar analysis has been performed in different systems: an enhancement of the polarisation signal of up to 10% is seen in the dim state of various higher mass stars, the UX Ori young variable stars (Grinin et al. 1998), and this is explained as an effect of sporadic obscuration of the star by material in its circumstellar disk (Dullemond et al. 2003).
4.4. Similarities to other systems
Dimming events similar to those observed for RW Aur A have recently been reported for AA Tau and V409 Tau (Bouvier et al. 2013; Rodriguez et al. 2015). Both systems show dimming events with ≳ 2 mag in V and durations ≳ 100 days, which have been postulated to be caused by obscuration of the central star by disk features rotating into view. In particular, from an analysis of molecular disk emission lines in the AA Tau system, Schneider et al. (2015a) showed that the disk emission within ~ 1 AU has varied across the dimming event, whereas little or no variation in the emission from the outer disk was observed in the outer disk. These models argue in the same direction as our proposed explanation for RW Aur A, namely a disturbance in the inner disk. The cause for this disturbance (e.g. a magnetic interaction or a close low-mass binary companion) might differ. Nevertheless, the analogy of the observed absorption signatures, rather grey extinction, and an increase in gas column density of the order of 1022 cm-2, suggests that their inner disks share many similarities.
5. Conclusions
We have analysed and compared X-shooter and UVES spectra of RW Aur A across the two recent dimming events. Our study yields the following conclusions:
-
We confirm previous analyses stating that the extinction of RWAur A during the second dimming event is compatible with beinggrey.
-
The optical Na and K doublets during the dim states show clear signatures of a blueshifted inner disk wind at ~− 60 km s-1.
-
We confirm earlier studies showing that RW Aur A spectrum looks highly veiled during the dimming events.
-
No major accretion variation is observed across the dimming events.
To interpret these results together with many other observations of the system, we have proposed a new mechanism that might be at the origin of the dimming events. In particular, we propose that these dimming events trace major perturbations of a misaligned or warped inner disk. This interpretation would collocate RW Aur A in a class of objects where the inner disk has caused significant photometric and spectrometric evolution of the hosted protoplanetary disk, such as the famous cases of AA Tau and V409 Tau (Bouvier et al. 2013; Rodriguez et al. 2015). Interestingly, RW Aur A has the additional peculiarity of having recently suffered a perturbing tidal encounter with its companion star RW Aur B.
Acknowledgments
We thank the anonymous referee, whose comment helped clarifying part of the paper. We are grateful to the ESO General Director for awarding DDT time to this project, and to the ESO staff, in particular Giacomo Beccari and Vincenzo Manieri, for carrying out the observations. We thank Max Pettini, Kevin France, and Simone Scaringi for helpful discussion, and Emma Whelan and Sylvie Cabrit for the UVES observations. We acknowledge with thanks the variable star observations from the AAVSO International Database contributed by observers worldwide and used in this research. During part of the project, S.F. was funded by an STFC/Isaac Newton Trust studentship in Cambridge. C.F.M. and P.C.S. gratefully acknowledge an ESA Research Fellowship. T.J.H. is funded by an Imperial Junior research fellowship. This work has been supported by the DISCSIM project, grant agreement 341137 funded by the European Research Council under ERC-2013-ADG.
References
- Alcalá, J. M., Natta, A., Manara, C. F., et al. 2014, A&A, 561, A2 [NASA ADS] [CrossRef] [EDP Sciences] [Google Scholar]
- Alencar, S. H. P., Basri, G., Hartmann, L., & Calvet, N. 2005, A&A, 440, 595 [NASA ADS] [CrossRef] [EDP Sciences] [Google Scholar]
- Andrews, S. M., & Williams, J. P. 2005, ApJ, 631, 1134 [NASA ADS] [CrossRef] [Google Scholar]
- Ansdell, M., Gaidos, E., Williams, J. P., et al. 2016, MNRAS, 462, L101 [NASA ADS] [CrossRef] [Google Scholar]
- Antipin, S., Belinski, A., Cherepashchuk, A., et al. 2015, Information Bulletin on Variable Stars, 6126, 1 [Google Scholar]
- Beristain, G., Edwards, S., & Kwan, J. 2001, ApJ, 551, 1037 [NASA ADS] [CrossRef] [Google Scholar]
- Bouvier, J., Alencar, S. H. P., Boutelier, T., et al. 2007, A&A, 463, 1017 [NASA ADS] [CrossRef] [EDP Sciences] [Google Scholar]
- Bouvier, J., Grankin, K., Ellerbroek, L. E., Bouy, H., & Barrado, D. 2013, A&A, 557, A77 [NASA ADS] [CrossRef] [EDP Sciences] [Google Scholar]
- Bozhinova, I., Scholz, A., Costigan, G., et al. 2016, MNRAS, 463, 4459 [NASA ADS] [CrossRef] [Google Scholar]
- Cabrit, S., Pety, J., Pesenti, N., & Dougados, C. 2006, A&A, 452, 897 [NASA ADS] [CrossRef] [EDP Sciences] [Google Scholar]
- Casassus, S., Marino, S., Pérez, S., et al. 2015, ApJ, 811, 92 [NASA ADS] [CrossRef] [Google Scholar]
- Chou, M.-Y., Takami, M., Manset, N., et al. 2013, AJ, 145, 108 [NASA ADS] [CrossRef] [Google Scholar]
- Clarke, C. J., & Pringle, J. E. 1993, MNRAS, 261, 190 [NASA ADS] [CrossRef] [Google Scholar]
- Cox, A. W., Grady, C. A., Hammel, H. B., et al. 2013, ApJ, 762, 40 [NASA ADS] [CrossRef] [Google Scholar]
- Crutcher, R. M. 1975, ApJ, 202, 634 [NASA ADS] [CrossRef] [Google Scholar]
- Dai, F., Facchini, S., Clarke, C. J., & Haworth, T. J. 2015, MNRAS, 449, 1996 [NASA ADS] [CrossRef] [Google Scholar]
- Dekker, H., D’Odorico, S., Kaufer, A., Delabre, B., & Kotzlowski, H. 2000, in Optical and IR Telescope Instrumentation and Detectors, eds. M. Iye, & A. F. Moorwood, Proc. SPIE, 4008, 534 [Google Scholar]
- Dodin, A. V., Lamzin, S. A., & Chuntonov, G. A. 2012, Astron. Lett., 38, 167 [NASA ADS] [CrossRef] [Google Scholar]
- Dullemond, C. P., van den Ancker, M. E., Acke, B., & van Boekel, R. 2003, ApJ, 594, L47 [NASA ADS] [CrossRef] [Google Scholar]
- Eisner, J. A., Hillenbrand, L. A., White, R. J., et al. 2007, ApJ, 669, 1072 [NASA ADS] [CrossRef] [Google Scholar]
- Facchini, S., Lodato, G., & Price, D. J. 2013, MNRAS, 433, 2142 [NASA ADS] [CrossRef] [Google Scholar]
- Facchini, S., Ricci, L., & Lodato, G. 2014, MNRAS, 442, 3700 [NASA ADS] [CrossRef] [Google Scholar]
- Folha, D. F. M., & Emerson, J. P. 2001, A&A, 365, 90 [NASA ADS] [CrossRef] [EDP Sciences] [Google Scholar]
- Foucart, F., & Lai, D. 2011, MNRAS, 412, 2799 [NASA ADS] [CrossRef] [Google Scholar]
- France, K., Schindhelm, E., Herczeg, G. J., et al. 2012, ApJ, 756, 171 [NASA ADS] [CrossRef] [Google Scholar]
- France, K., Herczeg, G. J., McJunkin, M., & Penton, S. V. 2014, ApJ, 794, 160 [NASA ADS] [CrossRef] [Google Scholar]
- Gahm, G. F., Petrov, P. P., Duemmler, R., Gameiro, J. F., & Lago, M. T. V. T. 1999, A&A, 352, L95 [NASA ADS] [Google Scholar]
- Ghez, A. M., White, R. J., & Simon, M. 1997, ApJ, 490, 353 [NASA ADS] [CrossRef] [Google Scholar]
- Giannini, T., Lorenzetti, D., Harutyunyan, A., et al. 2016, A&A, 588, A20 [NASA ADS] [CrossRef] [EDP Sciences] [Google Scholar]
- Grankin, K. N., Melnikov, S. Y., Bouvier, J., Herbst, W., & Shevchenko, V. S. 2007, A&A, 461, 183 [NASA ADS] [CrossRef] [EDP Sciences] [Google Scholar]
- Gregory, S. G., Donati, J.-F., Morin, J., et al. 2012, ApJ, 755, 97 [NASA ADS] [CrossRef] [Google Scholar]
- Grinin, V. P., Rostopchina, A. N., & Shakhovskoi, D. N. 1998, Astron. Lett., 24, 802 [NASA ADS] [Google Scholar]
- Hartigan, P., Edwards, S., & Ghandour, L. 1995, ApJ, 452, 736 [NASA ADS] [CrossRef] [Google Scholar]
- Ingleby, L., Calvet, N., Herczeg, G., et al. 2013, ApJ, 767, 112 [NASA ADS] [CrossRef] [Google Scholar]
- Johnson, H. L., & Morgan, W. W. 1953, ApJ, 117, 313 [NASA ADS] [CrossRef] [Google Scholar]
- Kafka, S. 2016, Observations from the AAVSO International Database, http://www.aavso.org [Google Scholar]
- Kwan, J., & Fischer, W. 2011, MNRAS, 411, 2383 [NASA ADS] [CrossRef] [Google Scholar]
- López-Martín, L., Cabrit, S., & Dougados, C. 2003, A&A, 405, L1 [NASA ADS] [CrossRef] [EDP Sciences] [Google Scholar]
- Manara, C. F., Beccari, G., Da Rio, N., et al. 2013, A&A, 558, A114 [NASA ADS] [CrossRef] [EDP Sciences] [Google Scholar]
- Marino, S., Perez, S., & Casassus, S. 2015, ApJ, 798, L44 [NASA ADS] [CrossRef] [Google Scholar]
- Mathis, J. S., Rumpl, W., & Nordsieck, K. H. 1977, ApJ, 217, 425 [NASA ADS] [CrossRef] [Google Scholar]
- McJunkin, M., France, K., Burgh, E. B., et al. 2013, ApJ, 766, 12 [NASA ADS] [CrossRef] [Google Scholar]
- Modigliani, A., Goldoni, P., Royer, F., et al. 2010, in SPIE Conf. Ser., 7737, 28 [Google Scholar]
- Morton, D. C., & Smith, W. H. 1973, ApJS, 26, 333 [Google Scholar]
- Ostriker, E. C. 1994, ApJ, 424, 292 [NASA ADS] [CrossRef] [Google Scholar]
- Pascucci, I., Edwards, S., Heyer, M., et al. 2015, ApJ, 814, 14 [NASA ADS] [CrossRef] [Google Scholar]
- Petrov, P. P., Gahm, G. F., Gameiro, J. F., et al. 2001a, A&A, 369, 993 [NASA ADS] [CrossRef] [EDP Sciences] [Google Scholar]
- Petrov, P. P., Pelt, J., & Tuominen, I. 2001b, A&A, 375, 977 [NASA ADS] [CrossRef] [EDP Sciences] [Google Scholar]
- Petrov, P. P., Gahm, G. F., Djupvik, A. A., et al. 2015, A&A, 577, A73 [NASA ADS] [CrossRef] [EDP Sciences] [Google Scholar]
- Rodgers, B., Wooden, D. H., Grinin, V., Shakhovsky, D., & Natta, A. 2002, ApJ, 564, 405 [NASA ADS] [CrossRef] [Google Scholar]
- Rodriguez, J. E., Pepper, J., Stassun, K. G., et al. 2013, AJ, 146, 112 [NASA ADS] [CrossRef] [Google Scholar]
- Rodriguez, J. E., Pepper, J., Stassun, K. G., et al. 2015, AJ, 150, 32 [NASA ADS] [CrossRef] [Google Scholar]
- Rodriguez, J. E., Reed, P. A., Siverd, R. J., et al. 2016, AJ, 151, 29 [NASA ADS] [CrossRef] [Google Scholar]
- Scaringi, S., Manara, C. F., Barenfeld, S. A., et al. 2016, MNRAS, 463, 2265 [NASA ADS] [CrossRef] [Google Scholar]
- Schneider, P. C., France, K., Günther, H. M., et al. 2015a, A&A, 584, A51 [NASA ADS] [CrossRef] [EDP Sciences] [Google Scholar]
- Schneider, P. C., Günther, H. M., Robrade, J., et al. 2015b, A&A, 584, L9 [NASA ADS] [CrossRef] [EDP Sciences] [Google Scholar]
- Shenavrin, V. I., Petrov, P. P., & Grankin, K. N. 2015, Information Bulletin on Variable Stars, 6143, 1 [Google Scholar]
- Stepanovs, D., Fendt, C., & Sheikhnezami, S. 2014, ApJ, 796, 29 [NASA ADS] [CrossRef] [Google Scholar]
- Takami, M., Wei, Y.-J., Chou, M.-Y., et al. 2016, ApJ, 820, 139 [NASA ADS] [CrossRef] [Google Scholar]
- van Leeuwen, F. 2007, A&A, 474, 653 [NASA ADS] [CrossRef] [EDP Sciences] [Google Scholar]
- Vernet, J., Dekker, H., D’Odorico, S., et al. 2011, A&A, 536, A105 [NASA ADS] [CrossRef] [EDP Sciences] [Google Scholar]
- Vink, J. S., Drew, J. E., Harries, T. J., Oudmaijer, R. D., & Unruh, Y. 2005, MNRAS, 359, 1049 [NASA ADS] [CrossRef] [Google Scholar]
- White, R. J., & Ghez, A. M. 2001, ApJ, 556, 265 [Google Scholar]
- Woitas, J., Leinert, C., & Köhler, R. 2001, A&A, 376, 982 [NASA ADS] [CrossRef] [EDP Sciences] [Google Scholar]
All Tables
All Figures
|
Fig. 1 X-shooter flux-calibrated spectrum of RW Aur A after telluric correction. The grey regions are dominated by atmospheric absorption. |
| In the text | |
|
Fig. 2 Left panel: light curve in V-band of the unresolved RW Aur system from the AAVSO database. The solid vertical lines show the dates when the UVES and X-shooter (black) spectra were taken (colour legend for UVES spectra is in Table 1). The dashed vertical lines show the dates of the four optical spectra by Chou et al. (2013), which overlap on the used scale. The brown and grey dashed-dotted lines show the dates of the two UV HST spectra by France et al. (2012, 2014, respectively). Right panel: same as in left panel, zoomed during the second dimming event. Data in both panels are from Kafka (2016). |
| In the text | |
|
Fig. 3 Left panel: photometry of the unresolved RW Aur system A (data from Grankin et al. 2007; Petrov et al. 2015); the red arrow shows the reddening vector for typical ISM-like dust, for AV = 1 (Mathis et al. 1977). Right panel: photometry of star A after subtraction of the averaged flux of star B (taken from White & Ghez 2001; Antipin et al. 2015) from the unresolved photometry. Legend: red dots are historical data from 1986 to 2005. Blue hexagons: first dimming. Black triangles: between the two dimming events. Orange pentagons: second dimming. Green star and green triangle: photometry of stars A and B, respectively, from A15. Brown triangle: star B from WG01. Magenta star: star A from our X-shooter spectrum. All points are in the Johnson system (Johnson & Morgan 1953). |
| In the text | |
|
Fig. 4 Top panel: Na i D lines from X-shooter. Central panel: Na i D lines from X-shooter and UVES before the dimming events. Bottom panel: K i D lines from X-shooter. All the velocities are heliocentric. |
| In the text | |
|
Fig. 5 Photometry of star A, as in the right panel of Fig. 3. Legend: grey dots are historical data from 1986 to 2005. Grey hexagons: first dimming. Grey triangles: between the two dimming events. Grey pentagons: second dimming. Green star and green triangle: photometry of stars A and B, respectively, from A15. Brown triangle: star B from WG01. Magenta star: star A from our X-shooter spectrum. All points are in the Johnson system. The coloured filled circles show photometric points closer than two days to the spectrographic observations with UVES and X-shooter. The colour code is reported in Table 1. |
| In the text | |
|
Fig. 6 Photospheric absorption lines of Ca i at 610.27 and 612.22 nm (left and central panel, respectively) and Li at 670.78 nm (right panel). |
| In the text | |
|
Fig. 7 Apparent accretion luminosities (accretion luminosities not corrected for extinction) from various emission lines labelled in the plot. The relations between |
| In the text | |
|
Fig. 8 Continuum-subtracted and normalised emission lines of He i at 587.56 nm in the heliocentric reference frame. |
| In the text | |
Current usage metrics show cumulative count of Article Views (full-text article views including HTML views, PDF and ePub downloads, according to the available data) and Abstracts Views on Vision4Press platform.
Data correspond to usage on the plateform after 2015. The current usage metrics is available 48-96 hours after online publication and is updated daily on week days.
Initial download of the metrics may take a while.