Fig. 2
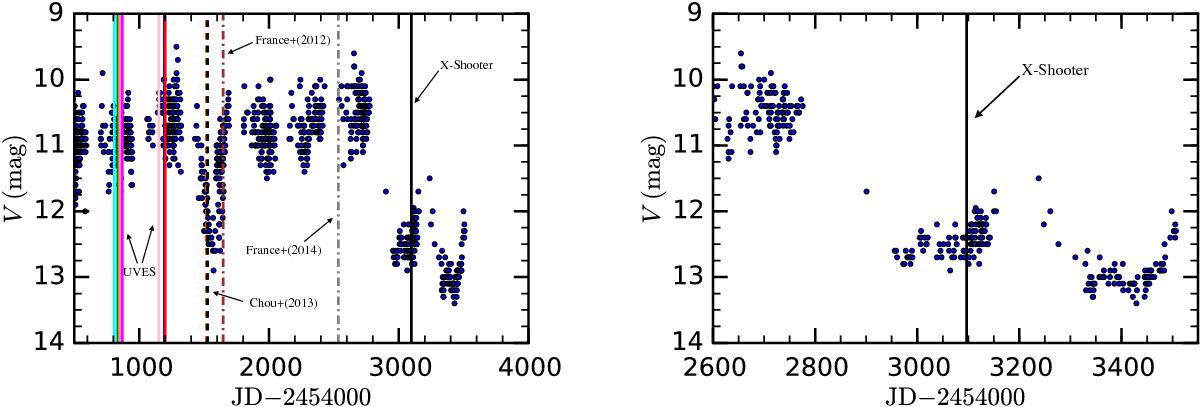
Left panel: light curve in V-band of the unresolved RW Aur system from the AAVSO database. The solid vertical lines show the dates when the UVES and X-shooter (black) spectra were taken (colour legend for UVES spectra is in Table 1). The dashed vertical lines show the dates of the four optical spectra by Chou et al. (2013), which overlap on the used scale. The brown and grey dashed-dotted lines show the dates of the two UV HST spectra by France et al. (2012, 2014, respectively). Right panel: same as in left panel, zoomed during the second dimming event. Data in both panels are from Kafka (2016).
Current usage metrics show cumulative count of Article Views (full-text article views including HTML views, PDF and ePub downloads, according to the available data) and Abstracts Views on Vision4Press platform.
Data correspond to usage on the plateform after 2015. The current usage metrics is available 48-96 hours after online publication and is updated daily on week days.
Initial download of the metrics may take a while.