| Issue |
A&A
Volume 596, December 2016
|
|
|---|---|---|
| Article Number | A68 | |
| Number of page(s) | 11 | |
| Section | Extragalactic astronomy | |
| DOI | https://doi.org/10.1051/0004-6361/201628667 | |
| Published online | 01 December 2016 | |
Galactic outflow driven by the active nucleus and the origin of the gamma-ray emission in NGC 1068
1 INAF–Osservatorio Astronomico di Roma, via di Frascati 33, 00078 Monte Porzio Catone, Italy
e-mail: This email address is being protected from spambots. You need JavaScript enabled to view it.
2 Department of Physics and Optical Engineering, ORT Braude College, 21982 Karmiel, Israel
3 ASDC–ASI, via del Politecnico, 00133 Roma, Italy
4 School of Physics, University of the Witwatersrand, Private Bag 3, 2050- Johannesburg, South Africa
5 INAF–Osservatorio Astrofisico di Torino, via Osservatorio, 20, 10025 Pino Torinese, Italy
6 Scuola Normale Superiore, Piazza dei Cavalieri 7, 56126 Pisa, Italy
Received: 8 April 2016
Accepted: 23 September 2016
Abstract
We compute the non-thermal emissions produced by relativistic particles accelerated by the shocks driven by the active galactic nucleus (AGN) in NGC 1068, and we compare the model predictions with the observed γ-ray and radio spectra. The former is produced by pion decay, inverse Compton scattering, and bremsstrahlung, while the latter is produced by synchrotron radiation. We derive the γ-ray and radio emissions by assuming the standard acceleration theory, and we discuss how our results compare with those corresponding to other commonly assumed sources of γ-ray and radio emissions, like supernova remnants (SNR) or AGN jets. We find that the AGN-driven shocks observed in the circumnuclear molecular disk of NGC 1068 provide a contribution to the γ-ray emission comparable to that provided by the starburst activity when standard particle acceleration efficiencies are assumed, while the shocks can yield the whole γ-ray emission only when the parameters describing the acceleration efficiency and the proton coupling with the molecular gas are tuned to values larger than those assumed in standard, SNR-driven shocks. We discuss the range of acceleration efficiencies (for protons and electrons) and of proton calorimetric fractions required to account for the observed γ-ray emission in the AGN outflow model. We further compare the neutrino flux expected in our model with constraints from current experiments, and we provide predictions for the detections by the upcoming KM3NeT neutrino telescope. This analysis strongly motivates observations of NGC 1068 at ≳TeV energies with current and future Cherenkov telescopes in order to gain insight into the nature of the γ-rays source.
Key words: galaxies: individual: NGC 1068 / galaxies: Seyfert / gamma rays: galaxies / radiation mechanisms: general
© ESO, 2016
1. Introduction
NGC 1068 is the brightest, closest, and best studied Seyfert 2 galaxy. The discovery of its Seyfert 1 nucleus in polarized light led Antonucci & Miller (1985) to propose the unification model of active galactic nuclei (AGN). In its central region, this source exhibits both starburst and AGN activity. Interferometric observations in the millimetre (mm) band identified a circumnuclear disk (CND) ~200 pc in radius, surrounded by a ~2 kpc starburst ring connected to the CND by a bar. In X-rays, the spectrum is dominated by reflection components of the primary AGN radiation by Compton thick material (i.e. with column density NH> 1.5 × 1024 cm-2), and in particular by a strong Kα iron line (EW ≃ 1, Matt et al. 2004). Recently Marinucci et al. (2016) detected a transient flux excess at energies above 20 keV that can be explained by a temporary decrease of NH along the line of sight. This event reveals the primary AGN emission and enables us to infer an intrinsic 2–10 keV luminosity of LX = 7 × 1043 erg s-1 (corresponding to bolometric luminosity LAGN ≃ 2.1 × 1045 erg s-1, Marconi et al. 2004).
NGC 1068 is a strong γ-ray emitter. It is the brightest of the few non-blazar galaxies detected by the Fermi Gamma-ray space telescope and with the flattest γ-ray spectrum (Ackermann et al. 2012). Models assuming that the γ-ray emission is entirely due to starburst activity failed to reproduce the observed spectrum (Yoast-Hull et al. 2014; Eichmann & Becker Tjus 2016). This suggests an alternative or complementary origin for the γ-ray emission (see e.g. Lenain et al. 2010).
Interestingly, sub-mm interferometry of molecular lines in the CND strongly suggests the existence of a giant, AGN-driven outflow which extends to ~100 pc scale with a velocity of ~100–200 km s-1 (Krips et al. 2011; García-Burillo et al. 2014). This outflow can induce shocks in the CND, which, in turn, can accelerate relativistic particles with an efficiency that may exceed that in a supernova remnant (SNR) and could leave observational signatures in different electromagnetic bands (Faucher-Giguère & Quataert 2012; Nims et al. 2015). In addition to primary accelerated electrons, the decay of neutral pions created by collisions between relativistic protons accelerated by the AGN shocks with ambient protons may produce a significant γ-ray emission. This hadronic γ-ray emission is mostly favoured as the dominant component of the γ-ray spectrum at energies above ≃100 MeV. At lower energies, leptonic processes like inverse Compton (IC) scattering and non-thermal bremsstrahlung can significantly contribute to the γ-ray emission. The same electrons responsible for IC and bremsstrahlung emission spiralling in interstellar magnetic fields radiate synchrotron emission in the radio continuum. The interpretation of the radio emission as a by-product of the AGN-driven outflow activity could in part explain the deviation of NGC 1068 from the observed correlation between the radio and far infrared (FIR) luminosities of star-forming galaxies. The FIR-radio correlation spans over five orders of magnitude in luminosity, from dwarf galaxies to starburst galaxies (Condon et al. 1991; Yun et al. 2001) and has been explained in terms of FIR emission related to dust heated by young massive stars, and radio emission associated to relativistic electrons accelerated in SNR. NGC 1068 is observed to have about four times larger radio luminosity than expected from the radio-FIR correlation (Yun et al. 2001). Radio emission from AGN-driven outflows can also explain the strong correlation between the kinematics of the ionized gas emission and the radio luminosity observed in obscured radio-quiet quasars at z ≲ 1 (Zakamska & Greene 2014).
In this picture, the γ-ray and radio luminosities are determined by the energy supplied to relativistic protons and electrons at the shock. In this paper we examine if the kinetic power of the AGN-driven outflow observed in NGC 1068 can account for the observed γ-ray and radio luminosities.
The paper is organized as follows. An overview of the observational data, including our Fermi Large Area Telescope (LAT) data analysis, is given in Sect. 2. The physical processes involved in the cosmic-ray (CR) particle energy distributions and the non-thermal emission produced by accelerated particles are described in Sect. 3. In Sect. 4 we present our results. Discussion and conclusion follow in Sects. 5 and 6.
Throughout the paper, we use a vacuum-dominated cosmological model with Ωm = 0.3, Ωλ = 0.7, and H0 = 70 km s-1 Mpc-1; and we adopt a distance to NGC 1068 of 14.4 Mpc, so that 1″≃ 70 pc.
2. Observational data
In this section we review the general structure and physical properties of the central region of NGC 1068, which we will use in the computation of the non-thermal emissions from accelerated particles in the AGN-driven shocks. NGC 1068 has been the target of several observational campaigns over the entire electromagnetic spectrum. In the radio band the continuum emission is spatially resolved into different structures: a 3 kpc diameter star-forming disk, a kpc-scale radio jet, and a 100 pc-scale jet and compact radio knots (e.g. Gallimore et al. 1996; Wynn-Williams et al. 1985; Gallimore et al. 2006; Sajina et al. 2011; Hönig et al. 2008). Near-IR observations of the narrow line region (NLR) revealed that the NLR gas is outflowing in a bicone that follows the path of the radio jet (Müller-Sánchez et al. 2011; Barbosa et al. 2014).
The distribution and kinematics of the molecular gas in the galaxy disk have been mapped through molecular line surveys (Müller Sánchez et al. 2009; Krips et al. 2011; García-Burillo et al. 2014, 2016; Barbosa et al. 2014; Gallimore et al. 2016). High resolution Atacama Large Millimetre/submillimetre Array (ALMA) observations spatially resolved the kinematics of the molecular gas within the few parsecs from the nucleus (the putative obscuring torus). The kinematics of the molecular gas in the torus show strong non-circular motions consistent with a bipolar outflow along the axis of the AGN accretion disk, similar to the outflow inferred for the NLR gas (García-Burillo et al. 2016; Gallimore et al. 2016). At larger scales, ALMA observations revealed a starburst ring of radius ~2 kpc and a CND. In CO maps the CND appears as an asymmetric ring of 350 pc × 200 pc size. The ring shows a rich substructure with two prominent knots located east and west of the position of the AGN.
By combining ALMA and Herschel observations, García-Burillo et al. (2014) derived the molecular gas mass of the CND from spectral energy distribution (SED) fitting of the dust continuum emission. They estimated Mgas ≃ (5 ± 3) × 107M⊙, which corresponds to a gas surface density Σgas ≃ (0.01−0.05) g cm-2 and to a gas number density nH = (115−460) cm-3 assuming a cylindrical geometry with radius R = 350 pc and vertical scale height h ≃ 10 pc (Schinnerer et al. 2000).
The above estimate of the gas surface density can be used to estimate the volume averaged interstellar medium (ISM) magnetic field strength of the CND from their empirical scaling relation BISM ≃ (30−110)μG (Robishaw et al. 2008; McBride et al. 2014).
2.1. Properties and powering source of the molecular outflow
A sizeable fraction of the total gas content in the CND is involved in a massive outflow (Krips et al. 2011; García-Burillo et al. 2014; Barbosa et al. 2014). The most relevant outflow properties in the derivation of the non-thermal emissions from shock accelerated particles is the kinetic energy injected into the ISM during the outflow timescale (see Sect. 3.1). The kinetic luminosity of the outflow is given by its bulk motion, and can be derived from the expression:  (1)where dMout/ dt is the mass outflow rate and vout is the outflow velocity.
From the broad CO(3–2) components in their spectra, García-Burillo et al. (2014) estimated the outflowing gas mass Mout = 1.8 × 10⁷M⊙, the average radial extent of the outflow Rout = 100 pc, and the projected radial outflow velocity vout,p ≃ 100 km s-1. Assuming a multi-conical outflow geometry, they derived the mass outflow rate as dMout/ dt = 3 × vout,p × Mout/Rout × tanα ≃ 63 M⊙ yr-1: here α is the unknown angle between the outflow and the line of sight. They assumed that the outflow is coplanar with the main disk, that is, tanα = 1/tani where i = 41° is the disk inclination angle, and, by replacing vout with vout,p/cosα in Eq. (1), they estimated an outflow kinetic luminosity equal to Lkin ≃ 5 × 1041 erg s-1. The main uncertainty of this estimate is due to the unknown inclination angle between the outflow and the line of sight.
Here we estimate Lkin without any assumptions about the inclination angle α. To this purpose, assuming that the outflow is isotropic we infer a maximum outflow velocity1vmax ≃ 200 km s-1 directly from the CO(3–2) spectra obtained with the Submillimeter Array (SMA) by Krips et al. (2011). We estimate the mass outflow rate as dMout/ dt = 3 × vmax × Mout/Rout ≃ 108 M⊙ yr-1, and the kinetic luminosity from Eq. (1) with vout = vmax. We derive Lkin = 1.5 × 1042 erg s-1.
The kinetic luminosity of the outflow indicates that AGN activity rather than star formation is the likely powering source of the outflow. Indeed, the star formation rate for the circumnuclear region out to a radius R ≃ 140 pc is SFR ≃ 1M⊙/yr (Esquej et al. 2014). This corresponds to a supernovae rate νSN ≃ 0.01 yr-1 for a Kroupa initial mass function (Kroupa 2001). Assuming a typical kinetic energy from a supernovae explosion of ESN = 1051 erg, the kinetic luminosity associated to star formation is Lkin = νSNESN ≃ 3 × 1041 erg s-1.
The jet power derived from the luminosity at 1.4 GHz Ljet = 1.8 × 1043 erg s-1 (García-Burillo et al. 2014), and the bolometric luminosity of the active nucleus estimated from mid-IR and X-ray bands LAGN = (4.2 × 1044−2.1 × 1045) erg s-1 (Bock et al. 2000; Alonso-Herrero et al. 2011; García-Burillo et al. 2014; Marinucci et al. 2016) indicate that the interaction of the CND gas with either the AGN jet and/or the energy released during accretion of matter onto the supermassive black hole are able to drive the molecular outflow.
2.2. gamma-ray spectrum
In the very high energy part of the electromagnetic spectrum NGC 1068 was observed by Fermi. Here we present our analysis of NGC 1068 Fermi-LAT data. The LAT instrument (Atwood et al. 2009) detects γ-rays in the energy range extending from 20 MeV to more than 300 GeV, by measuring their arrival time, energy, and direction. We analyzed NGC 1068 Fermi-LAT data collected from August 8, 2008 to February 28, 2016 in the energy range 100 MeV–300 GeV. We used the Fermi Science Tools (version v10r0p5) to produce and analyze cleaned and filtered event files, following the data analysis thread provided by the Fermi Science Support Center2. We considered the Pass 8 data (evclass = 128 & evtype = 3) and only events with zenith angles <90° to minimize the contamination from the Earth Limb. We filtered the data using good time intervals generated using the task gtmktime, with expression recommended by the LAT team of (DATA QUAL > 0)&&(LAT CONFIG==1). We adopted the “P8R2 SOURCE V6” instrumental response function (IRF).
The events are selected from a 40° × 40° squared region of interest (ROI), centred on NGC 1068. We used the binned maximum likelihood method to obtain the NGC 1068 spectral energy distribution. Our model includes all known sources in the Fermi-LAT 4-Year Point Source catalogue (3FGL, Acero et al. 2015), the diffuse Galactic background (gll_iem_v06.fits), and the diffuse extragalactic component (iso_P8R2_SOURCE_V6_v06.txt). The model file was generated with make3FGLxml.py6. We left free to vary only the brightest and variable sources in the ROI; moreover, the make3FGLxml.py script automatically adds 10° to the ROI, to account for sources that lie outside, but this may provide a photon contribution to our data. We also included a new source, not included in the 3FGL, located at a distance less than 4° from NGC 1068, centred on the peak of the LAT 100 MeV–100 GeV emission, modelled with a power-law model with free normalization and photon spectral index. This source is a factor of ~3 brighter than NGC 1068 in the 100–300 MeV energy range, with  3, and could be the counterpart of the 5BZQJ0239+0416 QSO RLoud flat-spectrum radio quasars (Massaro et al. 2015), located at a distance ~15′ from its LAT position. We found that NGC 1068 is fainter at energies 100–300 MeV than in the 3FGL catalogue. We verified that this is due to the addition of the new source. In fact, owing to the large low energy point spread function (PSF, i.e. 95% PSF is ~10° at ~100 MeV), the 3FGL flux is probably overestimated, including part of the emission of the new source.
At energies >10 GeV we found a spectral shape different from that of the 3FGL. This discrepancy is ascribed to the splitting of the energy bin, indeed using the same single bin (10–100 GeV) we reproduce the 3FGL results. Our analysis indicates a significant (~5σ) γ-ray emission at energies 10–30 GeV, while in the 30–100 GeV energy range we obtain only an upper limit. The 3σ upper limit is computed as follows: if T is the total number of counts measured at the position of a source, B are the expected background counts, and X are the unknown counts from the source, the 3σ (99.7%) upper limit on X can be defined as the number of counts X that gives a 0.3% probability to observe T (or less) counts. Applying the Poisson probability distribution function, X is therefore obtained by iteratively solving for different X values in the following equation:  (2)(see e.g., Narsky 2000).
We collected the counts T from a region centred on NGC 1068 with 1° radius, which contains more than 95% PSF, and estimated the B expected background counts in source free neighbouring regions. Finally we evaluated the flux from the counts, applying the vignetting corrected exposure time stored in the exposure maps.
The spectrum obtained from this anaysis, as well as the 3FGL spectrum, are shown in Fig. 2 (see also Table 1).
3. Theoretical modelling
3.1. Accelerated particle spectra
To build-up a model that predicts the γ-ray and radio spectra, we must first calculate the CR spectra.
CR particles are subject to a number of energy loss processes which cause distortions of their injection spectra as they propagate through the ISM. In the case of relativistic protons, pions production through inelastic collisions with ambient protons is the dominant loss mechanism. The collisional energy loss timescale is given by:  (3)where nH is the ISM gas density.
Protons can also escape from the acceleration region. The timescale on which CR particles are advected in the AGN-driven outflow is:  (4)From the above equations we compute the residence time of CR protons τp as:
  (5)A galaxy becomes a proton calorimeter when the residence time approximately equals the collisional energy loss timescale (Fcal ≡ τp/τpp = 1).
For relativistic electrons, the loss mechanisms involve interactions with matter, magnetic field, and radiation. For a gas density nH the energy loss rate due to bremsstrahlung emission is:  (6)while the loss rate due to ionization is:
  (7)The synchrotron cooling rate is given by:
  (8)where me is the electron mass, σT = 6.65 × 10⁻²⁵ cm-2 is the Thomson cross section, and
  is the magnetic energy density. Finally, the energy loss rate of a relativistic electron by IC scattering in the Thomson approximation is:
  (9)where
  is the radiation energy density at the location of the shock (Rout) and LAGN is the AGN luminosity4. The full Klein-Nishina cross section is used to compute the IC cooling timescale and the photon emission (see Fig. 1 and Sect. 3.3.2). Klein-Nishina effects imply a significant reduction of the CR electron energy loss rate compared to the Thomson limit (see e.g. Schlickeiser & Ruppel 2010). The residence time of CR electrons with energy E is therefore:
  (10)where (dE/ dt) is the sum of the processes described in Eqs. (6)–(9).
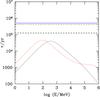 |
Fig. 1 Residence times of CR protons (dashed) and electrons (dotted) in the CND of NGC 1068 as a function of the particle’s energy. Red lines nH = 120 cm-3, BISM = 100 μG, LAGN = 2.1 × 1045 erg s-1, Urad = 3.7 × 10⁴ eV cm-3, Rshock = 100 pc, and vshock = 200 km s-1; black lines: nH = 400 cm-3, BISM = 350 μG, LAGN = 4.2 × 1044 erg s-1, Urad = 7.3 × 10³ eV cm-3, Rshock = 100 pc, and vshock = 200 km s-1. The solid blue line indicates the timescale of the AGN-driven molecular outflow. |
Figure 1 shows the residence times of CR protons and electrons in the CND of NGC 1068 as a function of the particle’s energy. The timescale on which CR particles are advected in the AGN-driven molecular outflow (τout) is also shown. The latter is comparable to the proton residence time, but much longer than the electron residence time. This implies that CR protons either interact with the CND gas or escape in the outflow, whereas CR electrons predominantly stay and cool in the CND.
The evolution of the CR energy spectrum as the particles diffuse from their source under conditions of energy losses is given by the diffusion-loss equation. If the timescale for particle acceleration is smaller than all other timescales (energy loss or escape), than the system will be in a steady state. The steady-state diffusion-loss equation for CRs with no spatial and temporal dependence is (Longair 2011): ![Mathematical equation: \begin{equation} \label{diffusion_eq} \frac{N(E)}{\tau_{\rm life}(E)} - \frac{{\rm d}}{{\rm d}E}[b(E)N(E)]-Q(E)=0, \end{equation}](/articles/aa/full_html/2016/12/aa28667-16/aa28667-16-eq107.png) (11)where E is the total energy, N(E) is the CR spectrum, Q(E) is CR source function, b(E) = −(dE/ dt) is the cooling rate of individual CR, and τlife(E) is the lifetime to diffusive or advective escape from the system.
(11)where E is the total energy, N(E) is the CR spectrum, Q(E) is CR source function, b(E) = −(dE/ dt) is the cooling rate of individual CR, and τlife(E) is the lifetime to diffusive or advective escape from the system.
Since pion production can be identified as a catastrophic loss (Torres 2004; Lacki & Beck 2013), the final proton spectrum can be obtained by solving Eq. (11) with b(E) → 0:  (12)where τp is the residence time of CR protons given in Eq. (5). The latter neglects diffusion losses. The role of diffusive escape constitutes a source of uncertainty in the computation. On the other hand, energy-dependent diffusion losses soften the γ-ray spectrum. The hard ≳GeV spectrum found for NGC 1068 suggests that the energy losses due to either hadronic interactions or advection dominate over diffusion losses. In the following we will neglect diffusion losses for both CR protons and electrons.
Since escape (advective and diffusive) is negligible for CR electrons (τlife(E) → 0), the final spectrum will have the form:  (13)if the spectrum of the injected electrons has the form Q(E) ∝ E− p.
It is generally believed that particle acceleration in strong shock waves, often referred to as diffusive shock acceleration (DSA), is the primary mechanism which produces energetic particles in astrophysical shocks (but see Vazza et al. 2015, 2016; van Weeren et al. 2016, for results showing that DSA has difficulties in explaining the observed emissions of particles accelerated in galaxy cluster shocks). DSA could result in the production of a power-law CR population with a power-law index p ≃ 2 (Bell 1978a,b; Blandford & Ostriker 1978; Drury 1983), that extends to energies as high as is permitted by various loss processes. Here we assume that DSA is effective in AGN-driven shocks, so we assume for the source functions the form: ![Mathematical equation: \begin{equation} Q_{\rm p}(E)=A_{\rm p}E^{-p}\exp\left[-\left(\frac{E}{E_{\max, \rm p}}\right)\right] \end{equation}](/articles/aa/full_html/2016/12/aa28667-16/aa28667-16-eq119.png) (14)and
(14)and ![Mathematical equation: \begin{equation} Q_{\rm e}(E)=A_{\rm e}E^{-p}\exp\left[-\left(\frac{E}{E_{\max, \rm e}}\right)\right], \end{equation}](/articles/aa/full_html/2016/12/aa28667-16/aa28667-16-eq120.png) (15)where the normalization constants Ap and Ae are determined by the total energy supplied to relativistic protons and electrons at the shock respectively, and Emax,p and Emax,e are the maximum energies of accelerated protons and electrons.
(15)where the normalization constants Ap and Ae are determined by the total energy supplied to relativistic protons and electrons at the shock respectively, and Emax,p and Emax,e are the maximum energies of accelerated protons and electrons.
As AGN-driven outflow is the assumed driver of CR acceleration, the CR particle spectrum must be related to the total energy input from the AGN:  (16)Here Lkin is the kinetic luminosity of the outflow, η is the fraction of the kinetic energy transferred to CR particles, τout is the outflow timescale, and τ is the residence time of CR particles. The physics governing the acceleration of particles in non-relativistic AGN-driven outflows is not well known, in particular we have no indication of the particle’s acceleration efficiency. A general indication can be obtained by viewing AGN-driven outflows as a SNR analogue. The comparison between the γ-ray and radio emissions from SNR and the kinetic energy supplied by supernova explosions suggest ηp ≃ (0.1−0.2) for CR protons and ηe ≃ (0.01−0.02) for CR electrons (Keshet et al. 2003; Thompson et al. 2006; Tatischeff 2008; Lacki et al. 2010, and references therein).
The maximum energy of accelerated particles depends on the age or size of the accelerator, on the particle energy-loss processes, and on the scale λ of the particle diffusion length. The expressions for the maximum achievable energy in the SNR context are given in Reynolds (2008): ![Mathematical equation: \begin{eqnarray} \label{Emax_age} E_{\max, \rm age}&=&0.5v_{\rm s,8}^2t_{\rm age,3}B_{\rm \mu G}f^{-1}~{\rm TeV} \\[2mm] \label{Emax_loss} E_{\max,\rm loss}&=&100v_{\rm s,8}(fB_{\rm \mu G})^{-0.5}~{\rm TeV} \\[2mm] \label{Emax_esc} E_{\max,\rm esc}&=&10B_{\rm \mu G} \lambda_{17}~{\rm TeV}, \end{eqnarray}](/articles/aa/full_html/2016/12/aa28667-16/aa28667-16-eq131.png) where vs,8 is the shock velocity in units of 108 cm s-1, tage,3 is the age of the accelerator in units of 103 yr, BμG is the magnetic field strength in units of μG, λ17 is the diffusion length in units of 1017 cm, and f parametrizes diffusion effects (f ≃ 1 for Bohm diffusion).
where vs,8 is the shock velocity in units of 108 cm s-1, tage,3 is the age of the accelerator in units of 103 yr, BμG is the magnetic field strength in units of μG, λ17 is the diffusion length in units of 1017 cm, and f parametrizes diffusion effects (f ≃ 1 for Bohm diffusion).
3.2. The physics of AGN-driven galactic outflows
The normalizations of the CR proton and electron spectra (Eq. (16)) depend on the kinetic energy injected into the ISM by the AGN-driven outflow during the residence time of CR particles. In this context, the most important question regarding the physics of AGN-driven galactic outflows is whether or not the outflow kinetic luminosity is constant in time.
Theoretical models postulate that the galactic non-relativistic outflows are produced when wide-angle fast winds (v ≃ 0.1−0.3 c) shock against the galaxy ISM (e.g. King 2003; King & Pounds 2003; King et al. 2011; Lapi et al. 2005; Faucher-Giguère & Quataert 2012; Zubovas & King 2012; Zubovas & Nayakshin 2014). These mildly relativistic winds are observed in the central regions of AGN (e.g. Chartas et al. 2002; Pounds et al. 2003; Reeves et al. 2003; Tombesi et al. 2010, 2015), and likely originate from the acceleration of gas particles in the accretion disk around super massive black holes by the AGN radiation field.
The fast wind impact implies a reverse shock that slows the wind and injects energy into the ISM. The shocked wind acts like a piston sweeping up the ISM. The supersonic swept-up gas drives a forward shock into the ISM, which is separated from the reverse shock by a contact discontinuity.
The cooling of the shocked fast wind determines whether the outflow kinetic energy is conserved (King et al. 2011; Faucher-Giguère & Quataert 2012). If the shocked-wind gas cools efficiently, most of the pre-shock kinetic energy is lost (usually to radiation), and only its momentum flux is transferred to the ISM (momentum-driven outflow). In contrast, if the cooling of the shocked-wind gas is inefficient, the shocked-wind gas retains all the mechanical luminosity thermalized in the shock, and expands adiabatically, pushing the ISM gas away (energy-driven outflow). In this case the momentum flux of the swept-up material in the ISM increases with time owing to the work done by the shocked gas. The expected momentum boost is predicted to be (dPout/ dt)/(LAGN/c) ≃ 10–100 (Zubovas & King 2012; Faucher-Giguère & Quataert 2012), where (dPout/ dt) = (dMout/ dt)vout is the momentum flux of the large-scale outflow, and LAGN/c is the momentum flux of the fast wind accelerated by AGN radiation pressure.
By comparing the IC cooling timescale of the shocked wind and the outflow timescale, King (2003; see King & Pounds 2015, for a review) found that momentum-driven outflows are confined to the nuclear region of galaxies, while energy-driven outflows affect a larger scale (but see Faucher-Giguère & Quataert 2012 for different results implying energy-driven outflow for a wide range of parameters characteristic of real galaxies).
Overall, the observations of kpc-scale AGN-driven molecular outflows in ultra luminous infra-red galaxies (ULIRGs) indicate large values of the ratio (dPout/ dt)/(LAGN/c) strongly suggesting the energy-driven regime for these outflows (e.g. Fischer et al. 2010; Sturm et al. 2011; Rupke & Veilleux 2011; Feruglio et al. 2010, 2015; Cicone et al. 2014). However, for the more compact molecular outflow observed in NGC 1068, we are not in a position to clearly distinguish its nature. Indeed, assuming the outflow mass rate and velocity derived in Sect. 2, we find (dPout/ dt) = 1.4 × 1035 g cm s-2. The latter is a moderate factor ~2–10 larger than (LAGN/c) = (1.4 × 1034−0.7 × 1035) g cm s-2. Thus, in the next sections, we will derive the γ-ray and radio emission by assuming both an energy-driven and a momentum-driven outflow. In the former case, Lkin is assumed constant in Eq. (16), and equal to the kinetic luminosity derived from sub-mm interferometry (see Sect. 2). In the latter case, Lkin varies in time. Since the kinetic luminosity  , in order to estimate the total kinetic energy injected into the ISM during the residence time of CR particles from the measured kinetic power, we need to know the gas density profile and the dynamics of the expansion.
To this purpose we adopt the models of King (2010) and Lapi et al. (2005; see also Menci et al. 2008).
Assuming an isothermal gas density profile and that all the fast wind energy not associated with the ram pressure is rapidly lost to radiation, King (2010) derived the analytic solution of the equation of motion of the momentum-driven shock pattern using the shell approximation. For the region outside the black-hole sphere of influence, they found R(t) ∝ at + bt0.5 + c where the constants a, b, and c are determined by the black-hole mass, the parameters of the galaxy potential, and by the position and the speed of the shell at time t = 0 (see King 2010). The above relation implies Lkin(t) ∝ t-1.5.
Assuming a power-law ambient density profile ρ(R) ∝ R− α (2 ≤ α ≤ 2.5), and the Rankine-Hugoniot boundary conditions in terms of the Mach number, Lapi et al. (2005) derived self-similar solutions of the partial differential equations describing the gas flow. They found R(t) ∝ t2 /α implying an outflow power Lkin ∝ t(10−5α) /α. These models correspond to kinetic energies injected into the ISM during the outflow timescale larger up to a factor of ~2 than those injected in the energy-conserving case.
3.3. Non-thermal emission produced by accelerated particles
3.3.1. γ-ray emission from neutral pion decays
CR protons can inelastically scatter off protons in the ISM to produce neutral and charged pions. Neutral pions decay into two γ-rays: π0 → γ + γ; while charged pions decay into secondary electrons and positrons and neutrinos: π+ → μ+ + νμ and  ;
;  and
and  .
.
To calculate the hadronic component of the γ-ray spectrum and the energy spectra of secondary particles (electrons, positrons, and neutrinos), we use the parametrizations derived by Kelner et al. (2006). These analytical approximations, which are based on simulations of proton-proton interactions, provide very good accuracy over the energy range of parent protons above 100 GeV. At lower energies the spectra are calculated using the δ-functional approximation (Aharonian & Atoyan 2000).
3.3.2. γ-ray emission from inverse Compton
The leptonic component of the γ-ray spectrum consists of IC scattering of the AGN radiation and non-thermal bremsstrahlung. The spectrum of photons generated per unit time due to IC scattering is (see e.g. Blumenthal & Gould 1970):  (20)where
  (21)is the differential input photon number density at the location of the shock. To calculate the output spectrum, we use the synthetic spectrum of a type 1 AGN as computed by Sazonov et al. (2004) normalized to the bolometric luminosity of NGC 1068. In Eq. (20) Ne represents the combined primary and secondary electron/positron spectrum from pion decay, and
 ![Mathematical equation: \begin{equation} \label{icm4} W(E_{\rm e},\epsilon,E_\gamma)= \frac{8\pi r_{\rm e}^2 c}{E_{\rm e}\,\eta}\left[2q\,\ln q+(1-q)\left(1+2q+ \frac{\eta^2q^2}{2\,(1+\eta q)}\right)\right], \end{equation}](/articles/aa/full_html/2016/12/aa28667-16/aa28667-16-eq170.png) (22)is the scattering cross-section, taking into account Klein-Nishina effects, with
(22)is the scattering cross-section, taking into account Klein-Nishina effects, with  and
and  .
.
3.3.3. γ-ray emission from bremsstrahlung
In the case of production by bremsstrahlung, the spectrum of photons generated per unit time is (Stecker 1971):  (23)where σbrem = 3.38 × 10⁻²⁶ cm2, and Ne represents the combined primary and secondary leptonic spectrum.
3.3.4. Radio emission from synchrotron
The majority of the radio flux comes from non-thermal synchrotron emission. We calculate the synchrotron emission following the standard formula from Rybicki & Lightman (1979). We calculate the radio spectra due to synchrotron emission by primary electrons and secondary electrons and positrons from pion decay. The radiation spectrum of a power-law electron energy distribution Ne(E) ∝ E− p may be expressed in terms of the magnetic field BISM and the frequency ν as  . Thus the spectral shape is determined by the shape of the electron distribution: if − p is the spectral index of the electron energy spectrum, the spectral index of the synchrotron emission is − (p−1)/2.
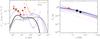 |
Fig. 2 γ-ray and radio spectra for NGC 1068. AGN-driven outflow parameters are set at Rout = 100 pc, vout = 200 km s-1, and Lkin = 1.5 × 1042 erg s-1; black lines: LAGN = 4.2 × 1044 erg s-1, nH = 104 cm-3, Fcal = 1, p = 2, ηp = 0.2, ηe = 0.02, BISM = 30μG (solid) and BISM = 2 mG (dashed); magenta line: LAGN = 2.1 × 1045 erg s-1, nH = 120 cm-3, Fcal = 0.5, p = 2, ηp = 0.5, ηe = 0.4, BISM = 250μG; blue line: LAGN = 4.2 × 1044 erg s-1, nH = 104 cm-3, Fcal = 1, p = 2, ηp = 0.3, ηe = 0.1, BISM = 600μG. γ-ray spectrum: violet dotted line: expected CTA-south differential sensitivity, from simulated data (5σ per energy bin – five per decade – in 50 h, zenith angle = 20 deg 5), grey dotted line: measured MAGIC differential sensitivity (5σ in 50 h at low zenith angles <30 deg, Aleksić et al. 2016), orange dotted line: measured H.E.S.S. II differential sensitivity (5σ in 50 h, zenith angle =18 deg, Holler et al. 2015). Data points: Fermi-LAT spectrum from our analysis (red filled circles), and from the 3FGL catalogue (Acero et al. 2015, black open circles). Radio spectrum: primary electrons emission (dashed line), secondary electrons/positrons emission (dotted line), total emission (solid line). Data points: total radio emission from ≃200 pc region (circles, Sajina et al. 2011), extra-nuclear radio emission from ≃1.1 kpc region (triangle, Gallimore et al. 2006). |
4. Results
Here we derive the non-thermal emission produced by CR particles accelerated in the AGN-driven outflow observed in NGC 1068 and we compare it with the γ-ray and radio spectra.
We compare the predicted γ-ray emission with the γ-ray spectrum from the 3FGL catalogue (Acero et al. 2015), and with the γ-ray spectrum obtained from our analysis of the Fermi-LAT data (Sect. 2.2). The Fermi-LAT observations do not spatially resolve the γ-ray emitting region. Therefore, we suppose that all the γ-ray flux is related to the inner ~100 pc of the galaxy. Conversely, the radio observations are spatially resolved. However, within 100 pc the presence of the radio jet hampers the identification of any emission not originating from the jet or the compact nucleus. The current radio observations provide therefore only limited constraints on the cosmic ray population outside the AGN jets (see also Yoast-Hull et al. 2014; Eichmann & Becker Tjus 2016). In the following analysis we consider the magnetic field derived from the radio observations as only an upper limit to the magnetic field strength in the shock region.
We derive the γ-ray and radio emissions for AGN-driven outflows in both the energy-driven and momentum-driven scenarios (Sect. 3.2). We assume for the outflow radius, velocity, and kinetic power the values obtained from sub-mm interferometry: Rout = 100 pc, vout = (100−200) km s-1, Lkin = (0.5−1.5) × 1042 (see Sect. 2); and for the proton and electron acceleration efficiencies, the SNR values: ηp = (0.1−0.2), and ηe = (0.01−0.02) (Lacki et al. 2010). We vary parameters such as the spectral index (p), the AGN bolometric luminosity (LAGN), the density experienced by CR particles (nH), and the magnetic field (BISM). The spectral index is restricted to the value p< 2.2 since larger values are ruled out by the combination of Fermi-LAT and IceCube observations (Murase et al. 2013). We vary the AGN bolometric luminosity within the range LAGN = (4.2 × 1044–2.1 × 1045) erg s-1, and the density experienced by CR particles in the range nH = (115−460) cm-3 (see Sect. 2). In this way we are assuming that the density experienced by CR particles is equal to the average density of the CND. However, CR particles do not necessarily propagate through gas with the average ISM density. This may be because the ISM is clumpy and the accelerated particles favour high-density clumps or they propagate along paths of least resistance. Thus, we also consider a simple calorimetric hadronic model in which CR protons loose almost all of their energy to hadronic collision before escaping (Fcal = 1). This condition could be satisfied if τpp ≪ τout and hence if nH ≳ 104 cm-3. Finally, for the magnetic field we assume values bracketed by a minimum value that is given by the volume average magnetic field strength of the CND (see Sect. 2) and a maximum value that is inferred from the radio observations.
The results are shown in Fig. 2. We find that, in the standard SNR acceleration theory, even selecting parameters to maximize the γ-ray emission, the predicted spectrum is lower than the observed data by a factor of approximately two at energies E ≳ 1 GeV, and by a factor of approximately ten at E ≃ 0.1 GeV.
In order to match the observed γ-ray spectrum acceleration efficiencies ηp ≥ 0.3 and ηe ≥ 0.1 are required. A strong coupling between the molecular medium in the CND and CR protons produced in the outflow shocks (Fcal ≥ 0.5) is also necessary (see Fig. 2). In the following we study the effect of changing each of the free quantities within the above ranges.
4.1. Energy-driven and momentum-driven outflow
The degree to which the observed outflow is energy-driven or momentum-driven influences the normalization of the CR particle spectrum (Eq. (16)). The difference in normalization in the two outflow regimes is maximized when the residence time of CR particles is equal to the outflow timescale. Since the residence time of CR electrons in the CND is much smaller than the outflow timescale (see Fig. 1), the leptonic components of the γ-ray spectrum and the radio spectrum are not strongly influenced by the nature of the outflow.
The residence time of CR protons is nearly equal to the outflow timescale for ISM density nH =120 cm-3 and decreases with increasing ISM density. Thus, only for low nH values do we find a significant difference in the two outflow regimes.
4.2. CR parameters: p, ηp, ηe
The slope of the hadronic component of the γ-ray spectrum reflects the slope of the underlying CR proton population p. A steeper primary CR proton spectrum correspond to a steeper γ-ray spectrum at energies ≳1 GeV.
The efficiencies ηp and ηe are the normalizations of the injected primary CR protons and electrons respectively (Eq. (16)). Larger ηp and ηe linearly increase the hadronic and leptonic components without changing the spectral shape, while lower values decrease these components.
4.3. ISM density
The ISM effective density experienced by CR particles determines the efficiency of hadronic losses Fcal. An increase in Fcal augments the γ-ray emission and the number of secondaries (electrons, positrons, and neutrinos) from pion decays. The ISM density also regulates the importance of bremsstrahlung and ionization losses for CR electrons.
Low density models can be distinguished observationally from the high density models by γ-ray emission below ~100 MeV: models with low nH are dominated by IC emission, whereas models with high nH are dominated by bremsstrahlung emission.
4.4. Magnetic field
The magnetic field affects the spectra in several ways. It determines the critical synchrotron frequency  ; at a fixed observed frequency, a stronger magnetic field implies that we see lower energy electrons.
The magnetic field strength determines the importance of synchrotron cooling relative to IC, bremsstrahlung, and ionization losses. If synchrotron cooling dominates over other cooling losses, the power-law index of the synchrotron radio spectrum changes from − (p–1)/2 to − p/2, and the radio luminosity approaches a maximum which is not affected by a further increase in BISM. The ratio of synchrotron to IC losses is equal to 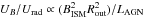 (Eqs. (8) and (9)). At Rout = 100 pc and for LAGN = (4.2 × 1044−2.1 × 1045) erg s-1, synchrotron losses start to dominate over IC losses (UB>Urad) if BISM ≳ 1.3 mG.
Finally, the magnetic field determines the maximum energy of CR protons and electrons (Eqs. (17)–(19)) that in turn determines the high energy cut-off seen in the γ-ray spectrum. Sensitive TeV observations are fundamental to assess the presence of a high-energy cut-off (see Fig. 2). Measuring a high energy cut-off can constrain in detail acceleration mechanisms operating in the shocks, since the maximum energy of accelerated particles depends on particle escape, age, or size of the accelerator, and particle energy-loss processes.
Sensitive TeV observations are also fundamental to estimate the total non-thermal high energy luminosity of the source, and to constrain the power-law index p of the accelerated CR proton population. To assess the performances of the present and next generation Cherenkov telescopes, we show in Fig. 2 the differential energy flux sensitivities of the Major Atmospheric Gamma Imaging Cherenkov (MAGIC) telescopes, of the High Energy Stereoscopic System (H.E.S.S.), and of the Cherenkov Telescope Array (CTA) corresponding to a 5σ level of confidence per energy bin (five bins per decade) after 50 h of effective observation time.
5. Discussion
5.1. Origin of the γ-ray emission
The results presented in the previous section indicate that the molecular outflow observed in the CND of NGC 1068 provides a contribution to the γ-ray emission at least comparable to that provided by SNR-driven shocks due to starburst activity (see Yoast-Hull et al. 2014; Eichmann & Becker Tjus 2016), when the same standard particle acceleration efficiencies are assumed (ηp ≈ 0.1−0.2 for protons, and ηp ≈ 0.01−0.02 for electrons). We have shown that the AGN outflow model can account for the observed γ-ray emission only when larger acceleration efficiencies are assumed for protons (ηp ≥ 0.3) and for electrons (ηe ≥ 0.1), and for calorimetric fractions Fcal ≥ 0.5.
At present, there is no clear observational support for such large acceleration efficiencies. In fact, we expect similarity between strong shocks with comparable velocity (e.g. Keshet et al. 2003). However, other parameters that determine the physics of the shock waves in the region near the AGN, like the pre-shock density and the magnetic field, could not be the same as those in the central regions of non active galaxies.
As for the calorimetric fraction, we note that if the molecular outflow is launched when the outflow of ionized gas and/or the inner jet sweeps the CND disk, the ionized outflow and the jet are not in the plane of the CND. However, a hint in favour of the strong coupling between CND molecular gas and the CR protons accelerated in the AGN-driven shocks comes from the chemical analysis of the molecular gas in the CND. The comparison between the abundances derived from molecular line surveys of the CND with those predicted by chemical models indicates that each sub-region of the CND could be characterized by three gas phases, two of which are pervaded by a CR ionization rate (and/or X-ray activity) enhanced by at least a factor of ten compared to the Galactic value (Aladro et al. 2013; Viti et al. 2014; see also Spinoglio et al. 2012). In contrast, if shock acceleration is limited to a narrow zone of the CND, as suggested by preliminary ALMA observations at ~0.5″ resolution (Kohno et al. 2016), even larger CR proton acceleration efficiencies are required in order to produce the observed γ-ray emission.
Modelling the chemistry in molecular disks around AGNs is a difficult task since the chemistry is affected by the different physical components of the systems, the disk density structure, and dynamical processes (e.g. Harada et al. 2013). Larger numbers of molecular transitions with high resolution are therefore necessary to properly determine the chemical and physical properties of the CND.
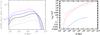 |
Fig. 3 Left: neutrino spectra for NGC 1068. Muon neutrino flux (dotted line), electron neutrino flux (dashed line), total neutrino flux (solid line). The neutrino fluxes expected from the models in Fig. 2 are shown with black, blue, and magenta lines. Right: IceCube effective area (red line), ANATARES effective area (blue line), muon neutrino KM3NeT effective area (magenta dotted line), and electron neutrino KM3NeT effective area (magenta dashed line). |
In cases where the γ-rays are from hadronic processes, the observed γ-ray emission can provide constraints on the CR ionization rate of molecular gas in the CND. However, the CR proton parameters derived by modelling the γ-ray emission characterize the proton spectrum at energies Ep ≳ 1 GeV (threshold for pion formation), while the molecular hydrogen is most effectively ionized by lower energy protons. Although it is likely that the latter are also accelerated in the shock, in order to derive the expected ionizing CR proton flux one should rely on complex extrapolations of the CR proton spectrum to energies Ep< 1 GeV (see e.g. Padovani et al. 2009; Schuppan et al. 2012).
An enhanced molecular ionization of the CND gas could therefore be an indication that the γ-ray emission has an hadronic component. The balance between the hadronic and leptonic contributions to the emission could constrain the origin of the γ-ray emission.
A leptonic scenario in which the γ-ray emission of NGC 1068 is produced through IC scattering of IR photons from the relativistic electrons in the misaligned jet at a few tenth of parsecs from the central source, was proposed by Lenain et al. (2010). The observations of NGC 1068 with current and upcoming Cherenkov telescopes are promising to test CR acceleration models in active galaxies. Indeed, the presence of γ-ray emission in the very high energy (VHE) band could provide a hint to assess the presence of hadronic emission. The leptonic γ-ray emission hardly extends to ≳TeV energies owing to the values of the shock velocity and of the magnetic field strength in the shock region (see Eq. (18), and Lenain et al. 2010).
The energy range below E ≃ 100 MeV is also crucial to constrain CR acceleration models. As shown in Sect. 4.3, the IC-dominated γ-ray spectrum can be distinguished from that dominated by bremsstrahlung emission at E ≲ 100 MeV (see Fig. 2, and Fig. 4 of Lenain et al. 2010). At present this spectral region is not observable; the new γ-ray missions that are being planned like ASTROMEV5 and ASTROGAM6 may bring a breakthrough in our understanding of γ-ray spectra in active galaxies.
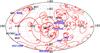 |
Fig. 4 Aitoff projection of the IceCube neutrinos in Galactic coordinate system. Red numbered points represent the location of each neutrino event and the surrounding circular areas show the respective median angular error (which includes systematic uncertainties). Black squares are local galaxies with |

5.2. Neutrino fluxes
Finally, the “smoking-gun” to demonstrate the presence of a hadronic component in the γ-ray spectrum is provided by the detection of a neutrino signal from NGC 1068. Indeed, in the proton-proton interactions, ~2/3 of the pions produced are charged pions that decay into muons and neutrinos followed by electrons and positrons and more neutrinos (see Sect. 3.3.1).
Neutrinos can also be created in interactions of CR protons with the ambient radiation field. Neutrinos created in proton-proton and in proton-photon interactions take ~5% of the initial CR proton energy. This means that 1 PeV neutrino is generated by the interaction of ~20 PeV CR protons. We find that the cooling time τpγ of 20 PeV CR protons due to the AGN radiation field in the CND of NGC 1068 is a factor (25–100) larger than the proton-proton collisional timescale. However, since τpγ decreases with increasing proton energy ( if the photon field is a simple power law n(ϵ) ∝ ϵ-2) the production of ≳PeV neutrinos through photo-hadronic processes could not be negligible.
Figure 3 shows the neutrino fluxes expected from the models presented in Sect. 4. To calculate the neutrino energy spectra, we follow the procedure described in Sect. 3.3.1. Neutrinos created in proton-proton interactions exhibit energy spectra that follow the initial CR proton spectrum.
In Table 2 we report the total number of neutrino events expected in one year of integration time of current and upcoming neutrino detectors. This is obtained from:  (24)where T is the observation time and Aeff is the effective area of Antares, IceCube, and KM3NeT as shown in Fig. 3. The expected number of neutrino events collected in current neutrino telescopes during one year is ≲0.1. However, our calculation suggests that in the near future, the IceCube’ s counterpart on the Northern Hemisphere, KM3NeT, will be able to reveal more effectively the neutrino signal from this kind of source. Moreover, thanks to the angular resolution of the ARCA instrument of ~0.2° for neutrino events with energy E ≳ 10 TeV (track-like events, Adrián-Martínez et al. 2016a), KM3NeT will allow us to constrain effectively the position of the possible counterparts of neutrino events, thus providing a possible direct test of the AGN outflow model.
At present, the analysis of positional coincidence of neutrino events with known astrophysical objects is a difficult task owing to the poor angular resolution of current neutrino detectors. Because of these large positional uncertainties, there are as yet no confirmed identifications for astrophysical sources of high-energy neutrino events (e.g. Aartsen et al. 2014; Adrián-Martínez et al. 2016b; The IceCube Collaboration et al. 2015).
Figure 4 shows the sky map of IceCube neutrino events, as well as the location of local galaxies (i.e. with recession velocities  km s-1) with IRAS 100 μm flux
  Jy. We also highlight the galaxies detected by Fermi-LAT. These are non-blazar galaxies with AGN and/or starburst activity in their nuclear regions. The location of NGC 1068 is in correspondence with one of the 54 neutrino events detected by IceCube in four years of data (Aartsen et al. 2014). The fact that all the Fermi-LAT galaxies lie within the acceptance region of a neutrino event suggests an intriguing scenario in which one may speculate that the γ-ray emission from particle acceleration in SNR-driven and/or AGN-driven shocks could have hadronic origin.
Positional associations of the neutrino events detected by IceCube to Seyfert and starburst galaxies in the Fermi-LAT and IRAS catalogues have been previously reported in the literature (Emig et al. 2015; Moharana & Razzaque 2016). A statistically significant correlation was found between IceCube neutrino events and local starburst galaxies, however, the expected neutrino fluxes derived from the γ-rays detected from individual sources disfavour the scenario proposed in this paper. The comparison between the photon and neutrino energetics represents a powerful diagnostic to identify the counterparts of high energy neutrino events. Recently, Padovani et al. (2016), on the basis of a joint energetic and positional diagnostic, have argued for a statistically significant correlation between high energy peacked BL Lacertae objects in the second catalogue of hard Fermi-LAT sources (2FHL, Ackermann et al. 2016) and five IceCube neutrino events. We expect that the situation will become clearer when KM3NeT is operative.
Predicted number of neutrino events in one year of integration time.
6. Conclusions
We computed the non-thermal emissions produced by CR particles accelerated in the shocks produced by the galactic AGN-driven outflow observed in NGC 1068. We found that, within the standard acceleration theory, the predicted γ-ray spectrum is lower than the observed data by a factor of approximately two at energies E ≳ 1 GeV, and by a factor of approximately ten at E ≃ 0.1 GeV. This contribution to the γ-ray emission is comparable to that provided by starburst activity (Yoast-Hull et al. 2014; Eichmann & Becker Tjus 2016).
The analysis presented in this paper indicates that the γ-ray emission from NGC 1068 is either entirely produced by leptonic processes – as proposed in the AGN jet model by Lenain et al. (2010) – or by processes with acceleration efficiencies of protons and electrons larger than those commonly assumed in SNR-driven shocks. The latter interpretation requires either a substantial revision of the standard acceleration theory, or the condition that AGN-driven shocks are substantially different from those powered by SNR.
The AGN outflow model proposed in this paper can be directly tested by present and forthcoming instruments. The observation of NGC 1068 at TeV energies with present and next generation Cherenkov telescopes could provide stringent constraints on CR acceleration models in active galaxies by the detection of a high-energy cut-off in the γ-ray spectrum. Moreover, in the near future the CTA spatial resolution of ~3 arcmin at energies E = (1−10) TeV might distinguish between point-like and extended γ-ray emission. In the case of extended emission, the determination of the centroid will allow us to determine if it originates from the nucleus or from the more extended starburst ring.
Another way to directly test the AGN outflow model is to look for a neutrino signal. The fluxes predicted by this model indicate that the neutrino signal from NGC 1068 may be detectable by the next generation neutrino telescope KM3NeT, which, thanks to the improved angular resolution compared to the current neutrino detectors, will allow us to constrain effectively the possible astrophysical sources of high energy neutrino events.
The AGN outflow model can also be indirectly tested. A potential test is to determine the CR ionization rate of the molecular medium in the CND. In fact, an enhanced molecular ionization of the CND gas could be an indication that the γ-ray emission has an hadronic component. Molecular line surveys toward the nucleus of NGC 1068 at ALMA resolution are therefore necessary to properly determine the chemical and physical properties of the CND gas.
Finally, the large efficiencies required to accelerate protons and electrons in the AGN outflow model imply a large production of CR particles. An immediate consequence is that weaker magnetic fields are required to produce the observed synchrotron emission in the radio continuum.
We compute the maximum velocity as in Rupke & Veilleux (2011).
The TS value is defined as TS = −2(L0−L1), where L0 and L1 are the logarithmic maximum likelihood values of null hypothesis and tested model including the target source. The square root of the TS is approximately equal to the detection significance for a given source.
The IR luminosity derived from the circumnuclear SFR and the SFR-LIR relation (Kennicutt 1998; Rieke et al. 2009) is LIR ≃ 3.3 × 1043 erg s-1. Thus within the CND the energy density of the AGN radiation field overwhelms that of the stellar component.
The sensitivity to be achieved by ASTROMEV for five years of survey is ≃10-12–10-11 erg cm-2 s-1 at E ≃ 1–100 MeV, http://astromev.in2p3.fr
The ASTROGAM expected sensitivity for an effective exposure of one year is ≃10-12–10-11 erg cm-2 s-1 at E ≃ 1–100 MeV, http://astrogam.iaps.inaf.it/scientific_instrument.html
Acknowledgments
We thank the Referee for his/her valuable comments that helped to improve the manuscript. A.L. and F.F. thank G. C. Perola for enlightening discussions. This work was supported by PRIN INAF 2014. S.C. acknowledges support by the South African Research Chairs Initiative of the Department of Science and Technology and National Research Foundation, and by the Square Kilometre Array (SKA). This work is based on the research supported by the South African Research Chairs Initiative of the Department of Science and Technology and National Research Foundation of South Africa (Grant No. 77948).
References
- Aartsen, M. G., Ackermann, M., Adams, J., et al. 2014, ApJ, 796, 109 [NASA ADS] [CrossRef] [Google Scholar]
- Aartsen, M. G., Abraham, K., Ackermann, M. et al. (IceCube Collaboration) 2015, ArXiv e-prints [arXiv:1510.05222] [Google Scholar]
- Acero, F., Ackermann, M., Ajello, M., et al. 2015, ApJS, 218, 23 [Google Scholar]
- Ackermann, M., Ajello, M., Allafort, A., et al. 2012, ApJ, 755, 164 [NASA ADS] [CrossRef] [Google Scholar]
- Ackermann, M., Ajello, M., Atwood, W. B., et al. 2016, ApJS, 222, 5 [NASA ADS] [CrossRef] [Google Scholar]
- Adrián-Martínez, S., Ageron, M., Aharonian, F., et al. 2016a, J. Phys. G: Nuclear Part. Phys., 43, 084001 [Google Scholar]
- Adrián-Martínez, S., Albert, A., André, M., et al. 2016b, ApJ, 823, 65 [Google Scholar]
- Aharonian, F. A., & Atoyan, A. M. 2000, A&A, 362, 937 [NASA ADS] [Google Scholar]
- Aladro, R., Viti, S., Bayet, E., et al. 2013, A&A, 549, A39 [NASA ADS] [CrossRef] [EDP Sciences] [Google Scholar]
- Aleksić, J., Ansoldi, S., Antonelli, L. A., et al. 2016, Astropart. Phys., 72, 76 [NASA ADS] [CrossRef] [Google Scholar]
- Alonso-Herrero, A., Ramos Almeida, C., Mason, R., et al. 2011, ApJ, 736, 82 [NASA ADS] [CrossRef] [Google Scholar]
- Antonucci, R. R. J., & Miller, J. S. 1985, ApJ, 297, 621 [NASA ADS] [CrossRef] [Google Scholar]
- Atwood, W. B., Abdo, A. A., Ackermann, M., et al. 2009, ApJ, 697, 1071 [NASA ADS] [CrossRef] [Google Scholar]
- Barbosa, F. K. B., Storchi-Bergmann, T., McGregor, P., Vale, T. B., & Rogemar Riffel, A. 2014, MNRAS, 445, 2353 [NASA ADS] [CrossRef] [Google Scholar]
- Bell, A. R. 1978a, MNRAS, 182, 147 [NASA ADS] [CrossRef] [Google Scholar]
- Bell, A. R. 1978b, MNRAS, 182, 443 [NASA ADS] [CrossRef] [Google Scholar]
- Blandford, R. D., & Ostriker, J. P. 1978, ApJ, 221, L29 [Google Scholar]
- Blumenthal, G. R., & Gould, R. J. 1970, Rev. Mod. Phys., 42, 237 [NASA ADS] [CrossRef] [Google Scholar]
- Bock, J. J., Neugebauer, G., Matthews, K., et al. 2000, AJ, 120, 2904 [NASA ADS] [CrossRef] [Google Scholar]
- Chartas, G., Brandt, W. N., Gallagher, S. C., & Garmire, G. P. 2002, ApJ, 579, 169 [NASA ADS] [CrossRef] [Google Scholar]
- Cicone, C., Maiolino, R., Sturm, E., et al. 2014, A&A, 562, A21 [NASA ADS] [CrossRef] [EDP Sciences] [Google Scholar]
- Condon, J. J., Anderson, M. L., & Helou, G. 1991, ApJ, 376, 95 [NASA ADS] [CrossRef] [Google Scholar]
- Drury, L. 1983, Space Sci. Rev., 36, 57 [NASA ADS] [CrossRef] [Google Scholar]
- Eichmann, B., & Becker Tjus, J. 2016, ApJ, 821, 87 [NASA ADS] [CrossRef] [Google Scholar]
- Emig, K., Lunardini, C., & Windhorst, R. 2015, JCAP, 12, 029 [NASA ADS] [CrossRef] [Google Scholar]
- Esquej, P., Alonso-Herrero, A., González-Martín, O., et al. 2014, ApJ, 780, 86 [Google Scholar]
- Faucher-Giguère, C.-A., & Quataert, E. 2012, MNRAS, 425, 605 [NASA ADS] [CrossRef] [Google Scholar]
- Feruglio, C., Maiolino, R., Piconcelli, E., et al. 2010, A&A, 518, L155 [NASA ADS] [CrossRef] [EDP Sciences] [Google Scholar]
- Feruglio, C., Fiore, F., Carniani, S., et al. 2015, A&A, 583, A99 [NASA ADS] [CrossRef] [EDP Sciences] [Google Scholar]
- Fischer, J., Sturm, E., González-Alfonso, E., et al. 2010, A&A, 518, L41 [NASA ADS] [CrossRef] [EDP Sciences] [Google Scholar]
- Gallimore, J. F., Baum, S. A., O’Dea, C. P., & Pedlar, A. 1996, ApJ, 458, 136 [NASA ADS] [CrossRef] [Google Scholar]
- Gallimore, J. F., Axon, D. J., O’Dea, C. P., Baum, S. A., & Pedlar, A. 2006, AJ, 132, 546 [NASA ADS] [CrossRef] [Google Scholar]
- Gallimore, J. F., Elitzur, M., Maiolino, R., et al. 2016, ApJ, 829, L7 [NASA ADS] [CrossRef] [Google Scholar]
- García-Burillo, S., Combes, F., Usero, A., et al. 2014, A&A, 567, A125 [NASA ADS] [CrossRef] [EDP Sciences] [Google Scholar]
- García-Burillo, S., Combes, F., Ramos Almeida, C., et al. 2016, ApJ, 823, L12 [NASA ADS] [CrossRef] [Google Scholar]
- Harada, N., Thompson, T. A., & Herbst, E. 2013, ApJ, 765, 108 [NASA ADS] [CrossRef] [Google Scholar]
- Holler, M., Berge, D., van Eldik, C., et al. 2015, Proc. 34th Int. Cosmic Ray Conf. (ICRC2015), [arXiv:1509.02902] [Google Scholar]
- Hönig, S. F., Prieto, M. A., & Beckert, T. 2008, A&A, 485, 33 [NASA ADS] [CrossRef] [EDP Sciences] [Google Scholar]
- Kelner, S. R., Aharonian, F. A., & Bugayov, V. V. 2006, Phys. Rev. D, 74, 034018 [NASA ADS] [CrossRef] [Google Scholar]
- Kennicutt, Jr., R. C. 1998, ApJ, 498, 541 [NASA ADS] [CrossRef] [Google Scholar]
- Keshet, U., Waxman, E., Loeb, A., Springel, V., & Hernquist, L. 2003, ApJ, 585, 128 [NASA ADS] [CrossRef] [Google Scholar]
- King, A. 2003, ApJ, 596, L27 [NASA ADS] [CrossRef] [Google Scholar]
- King, A., & Pounds, K. 2015, ARA&A, 53, 115 [Google Scholar]
- King, A. R. 2010, MNRAS, 402, 1516 [NASA ADS] [CrossRef] [Google Scholar]
- King, A. R., & Pounds, K. A. 2003, MNRAS, 345, 657 [NASA ADS] [CrossRef] [Google Scholar]
- King, A. R., Zubovas, K., & Power, C. 2011, MNRAS, 415, L6 [NASA ADS] [CrossRef] [Google Scholar]
- Kohno, K., Ando, R., Taniguchi, A., Izumi, T., & Tosaki, T. 2016, IAU Symp., 315 [arXiv:1601.00187] [Google Scholar]
- Krips, M., Martín, S., Eckart, A., et al. 2011, ApJ, 736, 37 [NASA ADS] [CrossRef] [Google Scholar]
- Kroupa, P. 2001, MNRAS, 322, 231 [NASA ADS] [CrossRef] [Google Scholar]
- Lacki, B. C., & Beck, R. 2013, MNRAS, 430, 3171 [NASA ADS] [CrossRef] [Google Scholar]
- Lacki, B. C., Thompson, T. A., & Quataert, E. 2010, ApJ, 717, 1 [NASA ADS] [CrossRef] [Google Scholar]
- Lapi, A., Cavaliere, A., & Menci, N. 2005, ApJ, 619, 60 [NASA ADS] [CrossRef] [Google Scholar]
- Lenain, J.-P., Ricci, C., Türler, M., Dorner, D., & Walter, R. 2010, A&A, 524, A72 [Google Scholar]
- Longair, M. S. 2011, in High Energy Astrophysics (Cambridge, UK: Cambridge University Press) [Google Scholar]
- Marconi, A., Risaliti, G., Gilli, R., et al. 2004, MNRAS, 351, 169 [NASA ADS] [CrossRef] [Google Scholar]
- Marinucci, A., Bianchi, S., Matt, G., et al. 2016, MNRAS, 456, L94 [NASA ADS] [CrossRef] [Google Scholar]
- Massaro, E., Maselli, A., Leto, C., et al. 2015, Ap&SS, 357, 75 [NASA ADS] [CrossRef] [Google Scholar]
- Matt, G., Bianchi, S., Guainazzi, M., & Molendi, S. 2004, A&A, 414, 155 [NASA ADS] [CrossRef] [EDP Sciences] [Google Scholar]
- McBride, J., Quataert, E., Heiles, C., & Bauermeister, A. 2014, ApJ, 780, 182 [NASA ADS] [CrossRef] [Google Scholar]
- Menci, N., Fiore, F., Puccetti, S., & Cavaliere, A. 2008, ApJ, 686, 219 [NASA ADS] [CrossRef] [Google Scholar]
- Moharana, R., & Razzaque, S. 2016, ArXiv e-prints [arXiv:1606.04420] [Google Scholar]
- Müller Sánchez, F., Davies, R. I., Genzel, R., et al. 2009, ApJ, 691, 749 [NASA ADS] [CrossRef] [Google Scholar]
- Müller-Sánchez, F., Prieto, M. A., Hicks, E. K. S., et al. 2011, ApJ, 739, 69 [NASA ADS] [CrossRef] [Google Scholar]
- Murase, K., Ahlers, M., & Lacki, B. C. 2013, Phys. Rev. D, 88, 121301 [NASA ADS] [CrossRef] [Google Scholar]
- Narsky, I. 2000, ArXiv e-print [arXiv:hep-ex/0005019] [Google Scholar]
- Nims, J., Quataert, E., & Faucher-Giguère, C.-A. 2015, MNRAS, 447, 3612 [NASA ADS] [CrossRef] [Google Scholar]
- Padovani, M., Galli, D., & Glassgold, A. E. 2009, A&A, 501, 619 [NASA ADS] [CrossRef] [EDP Sciences] [Google Scholar]
- Padovani, P., Resconi, E., Giommi, P., Arsioli, B., & Chang, Y. L. 2016, MNRAS, 457, 3582 [NASA ADS] [CrossRef] [Google Scholar]
- Pounds, K. A., Reeves, J. N., King, A. R., et al. 2003, MNRAS, 345, 705 [NASA ADS] [CrossRef] [Google Scholar]
- Reeves, J. N., O’Brien, P. T., & Ward, M. J. 2003, ApJ, 593, L65 [NASA ADS] [CrossRef] [Google Scholar]
- Reynolds, S. P. 2008, ARA&A, 46, 89 [Google Scholar]
- Rieke, G. H., Alonso-Herrero, A., Weiner, B. J., et al. 2009, ApJ, 692, 556 [NASA ADS] [CrossRef] [Google Scholar]
- Robishaw, T., Quataert, E., & Heiles, C. 2008, ApJ, 680, 981 [NASA ADS] [CrossRef] [Google Scholar]
- Rupke, D. S. N., & Veilleux, S. 2011, ApJ, 729, L27 [NASA ADS] [CrossRef] [Google Scholar]
- Rybicki, G. B., & Lightman, A. P. 1979, in Radiative processes in astrophysics (Wiley) [Google Scholar]
- Sajina, A., Partridge, B., Evans, T., et al. 2011, ApJ, 732, 45 [NASA ADS] [CrossRef] [Google Scholar]
- Sazonov, S. Y., Ostriker, J. P., & Sunyaev, R. A. 2004, MNRAS, 347, 144 [NASA ADS] [CrossRef] [Google Scholar]
- Schinnerer, E., Eckart, A., Tacconi, L. J., Genzel, R., & Downes, D. 2000, ApJ, 533, 850 [NASA ADS] [CrossRef] [Google Scholar]
- Schlickeiser, R., & Ruppel, J. 2010, New J. Phys., 12, 033044 [NASA ADS] [CrossRef] [Google Scholar]
- Schuppan, F., Becker, J. K., Black, J. H., & Casanova, S. 2012, A&A, 541, A126 [NASA ADS] [CrossRef] [EDP Sciences] [Google Scholar]
- Spinoglio, L., Pereira-Santaella, M., Busquet, G., et al. 2012, ApJ, 758, 108 [NASA ADS] [CrossRef] [Google Scholar]
- Stecker, F. W. 1971, NASA Sp. Publ., 249 [Google Scholar]
- Sturm, E., González-Alfonso, E., Veilleux, S., et al. 2011, ApJ, 733, L16 [NASA ADS] [CrossRef] [Google Scholar]
- Tatischeff, V. 2008, [arXiv:0804.1004] [Google Scholar]
- Thompson, T. A., Quataert, E., Waxman, E., Murray, N., & Martin, C. L. 2006, ApJ, 645, 186 [NASA ADS] [CrossRef] [Google Scholar]
- Tombesi, F., Sambruna, R. M., Reeves, J. N., et al. 2010, ApJ, 719, 700 [NASA ADS] [CrossRef] [Google Scholar]
- Tombesi, F., Meléndez, M., Veilleux, S., et al. 2015, Nature, 519, 436 [Google Scholar]
- Torres, D. F. 2004, ApJ, 617, 966 [NASA ADS] [CrossRef] [Google Scholar]
- van Weeren, R. J., Brunetti, G., Brüggen, M., et al. 2016, ApJ, 818, 204 [NASA ADS] [CrossRef] [Google Scholar]
- Vazza, F., Eckert, D., Brüggen, M., & Huber, B. 2015, MNRAS, 451, 2198 [NASA ADS] [CrossRef] [Google Scholar]
- Vazza, F., Brüggen, M., Wittor, D., et al. 2016, MNRAS, 459, 70 [NASA ADS] [CrossRef] [Google Scholar]
- Viti, S., García-Burillo, S., Fuente, A., et al. 2014, A&A, 570, A28 [NASA ADS] [CrossRef] [EDP Sciences] [Google Scholar]
- Wynn-Williams, C. G., Becklin, E. E., & Scoville, N. Z. 1985, ApJ, 297, 607 [NASA ADS] [CrossRef] [Google Scholar]
- Yoast-Hull, T. M., Gallagher, III, J. S., Zweibel, E. G., & Everett, J. E. 2014, ApJ, 780, 137 [NASA ADS] [CrossRef] [Google Scholar]
- Yun, M. S., Reddy, N. A., & Condon, J. J. 2001, ApJ, 554, 803 [NASA ADS] [CrossRef] [Google Scholar]
- Zakamska, N. L., & Greene, J. E. 2014, MNRAS, 442, 784 [NASA ADS] [CrossRef] [Google Scholar]
- Zubovas, K., & King, A. 2012, ApJ, 745, L34 [Google Scholar]
- Zubovas, K., & Nayakshin, S. 2014, MNRAS, 440, 2625 [NASA ADS] [CrossRef] [Google Scholar]
All Tables
All Figures
|
Fig. 1 Residence times of CR protons (dashed) and electrons (dotted) in the CND of NGC 1068 as a function of the particle’s energy. Red lines nH = 120 cm-3, BISM = 100 μG, LAGN = 2.1 × 1045 erg s-1, Urad = 3.7 × 10⁴ eV cm-3, Rshock = 100 pc, and vshock = 200 km s-1; black lines: nH = 400 cm-3, BISM = 350 μG, LAGN = 4.2 × 1044 erg s-1, Urad = 7.3 × 10³ eV cm-3, Rshock = 100 pc, and vshock = 200 km s-1. The solid blue line indicates the timescale of the AGN-driven molecular outflow. |
| In the text | |
|
Fig. 2 γ-ray and radio spectra for NGC 1068. AGN-driven outflow parameters are set at Rout = 100 pc, vout = 200 km s-1, and Lkin = 1.5 × 1042 erg s-1; black lines: LAGN = 4.2 × 1044 erg s-1, nH = 104 cm-3, Fcal = 1, p = 2, ηp = 0.2, ηe = 0.02, BISM = 30μG (solid) and BISM = 2 mG (dashed); magenta line: LAGN = 2.1 × 1045 erg s-1, nH = 120 cm-3, Fcal = 0.5, p = 2, ηp = 0.5, ηe = 0.4, BISM = 250μG; blue line: LAGN = 4.2 × 1044 erg s-1, nH = 104 cm-3, Fcal = 1, p = 2, ηp = 0.3, ηe = 0.1, BISM = 600μG. γ-ray spectrum: violet dotted line: expected CTA-south differential sensitivity, from simulated data (5σ per energy bin – five per decade – in 50 h, zenith angle = 20 deg 5), grey dotted line: measured MAGIC differential sensitivity (5σ in 50 h at low zenith angles <30 deg, Aleksić et al. 2016), orange dotted line: measured H.E.S.S. II differential sensitivity (5σ in 50 h, zenith angle =18 deg, Holler et al. 2015). Data points: Fermi-LAT spectrum from our analysis (red filled circles), and from the 3FGL catalogue (Acero et al. 2015, black open circles). Radio spectrum: primary electrons emission (dashed line), secondary electrons/positrons emission (dotted line), total emission (solid line). Data points: total radio emission from ≃200 pc region (circles, Sajina et al. 2011), extra-nuclear radio emission from ≃1.1 kpc region (triangle, Gallimore et al. 2006). |
| In the text | |
|
Fig. 3 Left: neutrino spectra for NGC 1068. Muon neutrino flux (dotted line), electron neutrino flux (dashed line), total neutrino flux (solid line). The neutrino fluxes expected from the models in Fig. 2 are shown with black, blue, and magenta lines. Right: IceCube effective area (red line), ANATARES effective area (blue line), muon neutrino KM3NeT effective area (magenta dotted line), and electron neutrino KM3NeT effective area (magenta dashed line). |
| In the text | |
|
Fig. 4 Aitoff projection of the IceCube neutrinos in Galactic coordinate system. Red numbered points represent the location of each neutrino event and the surrounding circular areas show the respective median angular error (which includes systematic uncertainties). Black squares are local galaxies with |
| In the text | |
Current usage metrics show cumulative count of Article Views (full-text article views including HTML views, PDF and ePub downloads, according to the available data) and Abstracts Views on Vision4Press platform.
Data correspond to usage on the plateform after 2015. The current usage metrics is available 48-96 hours after online publication and is updated daily on week days.
Initial download of the metrics may take a while.