Fig. 3
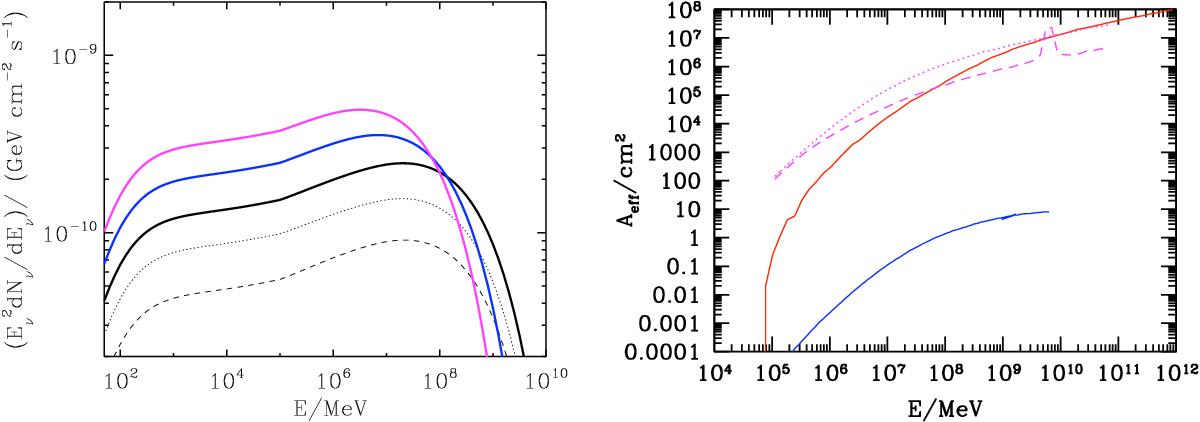
Left: neutrino spectra for NGC 1068. Muon neutrino flux (dotted line), electron neutrino flux (dashed line), total neutrino flux (solid line). The neutrino fluxes expected from the models in Fig. 2 are shown with black, blue, and magenta lines. Right: IceCube effective area (red line), ANATARES effective area (blue line), muon neutrino KM3NeT effective area (magenta dotted line), and electron neutrino KM3NeT effective area (magenta dashed line).
Current usage metrics show cumulative count of Article Views (full-text article views including HTML views, PDF and ePub downloads, according to the available data) and Abstracts Views on Vision4Press platform.
Data correspond to usage on the plateform after 2015. The current usage metrics is available 48-96 hours after online publication and is updated daily on week days.
Initial download of the metrics may take a while.