Fig. 2
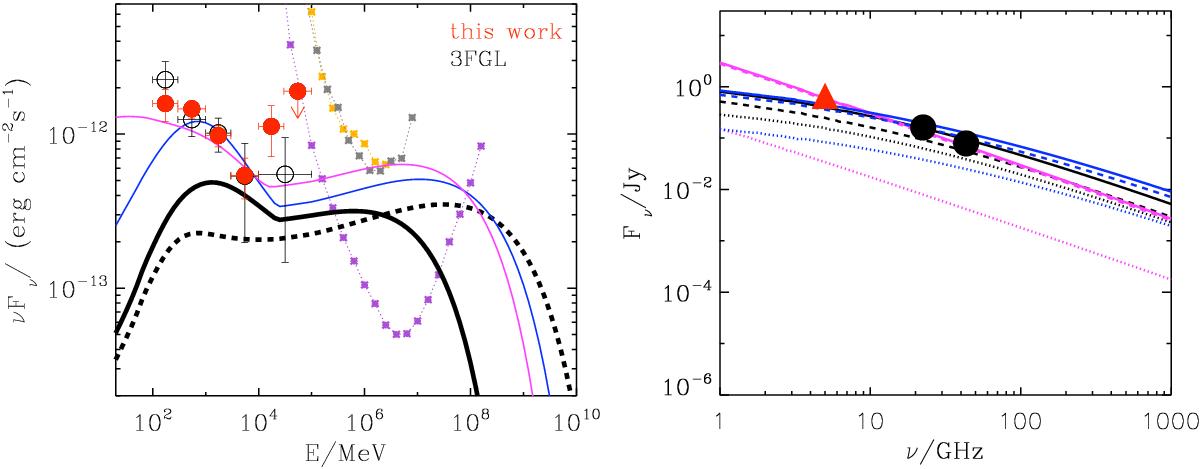
γ-ray and radio spectra for NGC 1068. AGN-driven outflow parameters are set at Rout = 100 pc, vout = 200 km s-1, and Lkin = 1.5 × 1042 erg s-1; black lines: LAGN = 4.2 × 1044 erg s-1, nH = 104 cm-3, Fcal = 1, p = 2, ηp = 0.2, ηe = 0.02, BISM = 30μG (solid) and BISM = 2 mG (dashed); magenta line: LAGN = 2.1 × 1045 erg s-1, nH = 120 cm-3, Fcal = 0.5, p = 2, ηp = 0.5, ηe = 0.4, BISM = 250μG; blue line: LAGN = 4.2 × 1044 erg s-1, nH = 104 cm-3, Fcal = 1, p = 2, ηp = 0.3, ηe = 0.1, BISM = 600μG. γ-ray spectrum: violet dotted line: expected CTA-south differential sensitivity, from simulated data (5σ per energy bin – five per decade – in 50 h, zenith angle = 20 deg 5), grey dotted line: measured MAGIC differential sensitivity (5σ in 50 h at low zenith angles <30 deg, Aleksić et al. 2016), orange dotted line: measured H.E.S.S. II differential sensitivity (5σ in 50 h, zenith angle =18 deg, Holler et al. 2015). Data points: Fermi-LAT spectrum from our analysis (red filled circles), and from the 3FGL catalogue (Acero et al. 2015, black open circles). Radio spectrum: primary electrons emission (dashed line), secondary electrons/positrons emission (dotted line), total emission (solid line). Data points: total radio emission from ≃200 pc region (circles, Sajina et al. 2011), extra-nuclear radio emission from ≃1.1 kpc region (triangle, Gallimore et al. 2006).
Current usage metrics show cumulative count of Article Views (full-text article views including HTML views, PDF and ePub downloads, according to the available data) and Abstracts Views on Vision4Press platform.
Data correspond to usage on the plateform after 2015. The current usage metrics is available 48-96 hours after online publication and is updated daily on week days.
Initial download of the metrics may take a while.