Fig. 8
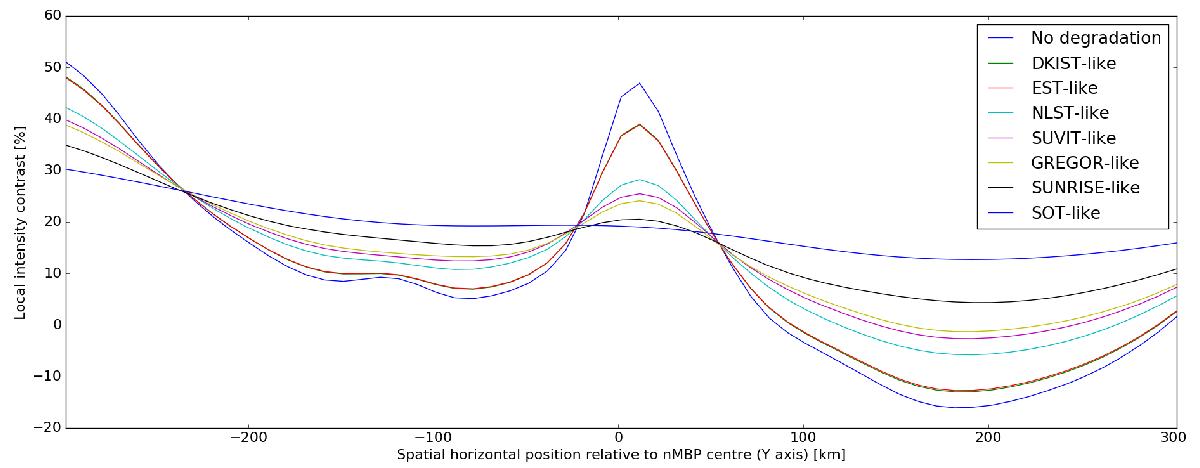
Intensity contrast in the continuum at 5000 Å across the nMBP of Fig. 7 (section along y-axis), using degraded images obtained with a variety of PSFs that correspond to the solar telescopes listed in the text. The legend orders the telescopes according to the simulated peak contrast, from highest to lowest. The curves with degradations corresponding to DKIST and EST are close to congruent. The coordinate x = 0 corresponds to the centre of the nMBP, which is taken to be the point of lowest density in the τ = 1 isosurface. Note that the peak intensity is displaced with respect to this nMBP centre because the nMBP funnel is inclined with respect to the vertical direction, as is often the case, such as that visible in the right-hand panel of Fig. 2.
Current usage metrics show cumulative count of Article Views (full-text article views including HTML views, PDF and ePub downloads, according to the available data) and Abstracts Views on Vision4Press platform.
Data correspond to usage on the plateform after 2015. The current usage metrics is available 48-96 hours after online publication and is updated daily on week days.
Initial download of the metrics may take a while.