Free Access
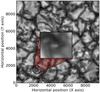
Fig. 7
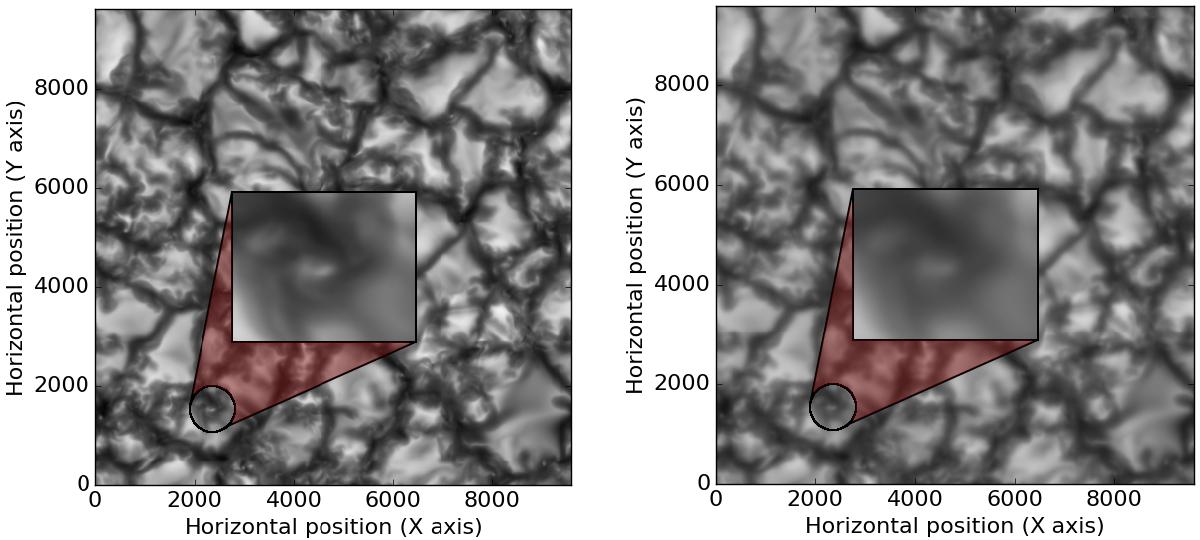
Single snapshot of the Roe10 simulation showing the intensity in the continuum at 5000 Å (left) and the corresponding degraded image with a GREGOR-like point-spread function (right). A typical nMBP of 80 km diameter is magnified.
This figure is made of several images, please see below:
Current usage metrics show cumulative count of Article Views (full-text article views including HTML views, PDF and ePub downloads, according to the available data) and Abstracts Views on Vision4Press platform.
Data correspond to usage on the plateform after 2015. The current usage metrics is available 48-96 hours after online publication and is updated daily on week days.
Initial download of the metrics may take a while.