Fig. 3
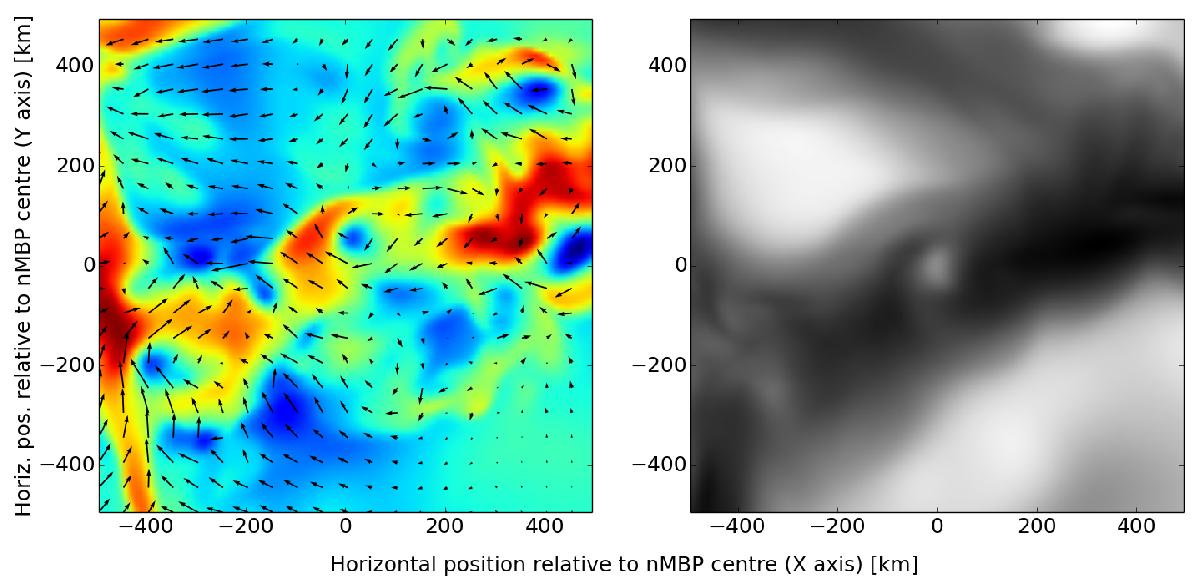
Left: low-density regions in a sub-surface layer 200 km below ⟨τ⟩ = 1 sustaining swirls. The colour map extends from blue, indicating low density, to red, indicating high density, and the arrows represent the plasma velocity projected into the horizontal plane. Longest arrows correspond to a velocity of 9.5 km s-1. Such swirling low density regions are much more abundant than nMBPs but most of them do not extend into the photosphere and therefore do not produce nMBPs. Right: corresponding bolometric intensity map. Of the several low density swirling regions in the left panel only the one at (x,y) = (0,0) produces a nMBP.
Current usage metrics show cumulative count of Article Views (full-text article views including HTML views, PDF and ePub downloads, according to the available data) and Abstracts Views on Vision4Press platform.
Data correspond to usage on the plateform after 2015. The current usage metrics is available 48-96 hours after online publication and is updated daily on week days.
Initial download of the metrics may take a while.