Fig. 2
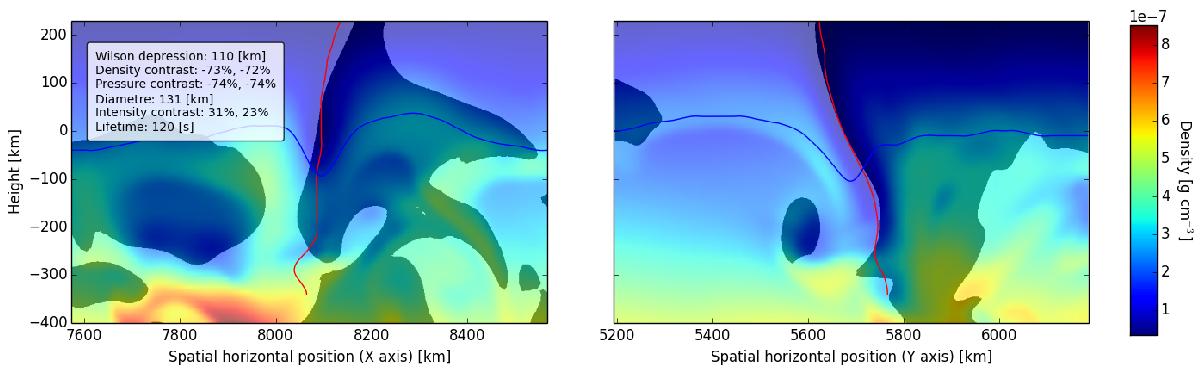
Vertical sections through the nMBP shown in Fig. 1. The background colour shows mass density, where the brightness encodes the sign of the velocity perpendicular to the plane of projection: bright is plasma flowing out of the plane and dark is plasma flowing into it. The red curve indicates the spine of the nMBP, a “valley” in density, found as a sequence of local density minima in horizontal planes. The blue curve indicates the Rosseland optical depth unity. The legend gives intensity, density, and gas pressure contrast, firstly with respect to the neighbourhood and secondly with respect to the global average (at τ = 1 for the density and the pressure).
Current usage metrics show cumulative count of Article Views (full-text article views including HTML views, PDF and ePub downloads, according to the available data) and Abstracts Views on Vision4Press platform.
Data correspond to usage on the plateform after 2015. The current usage metrics is available 48-96 hours after online publication and is updated daily on week days.
Initial download of the metrics may take a while.