Fig. 1
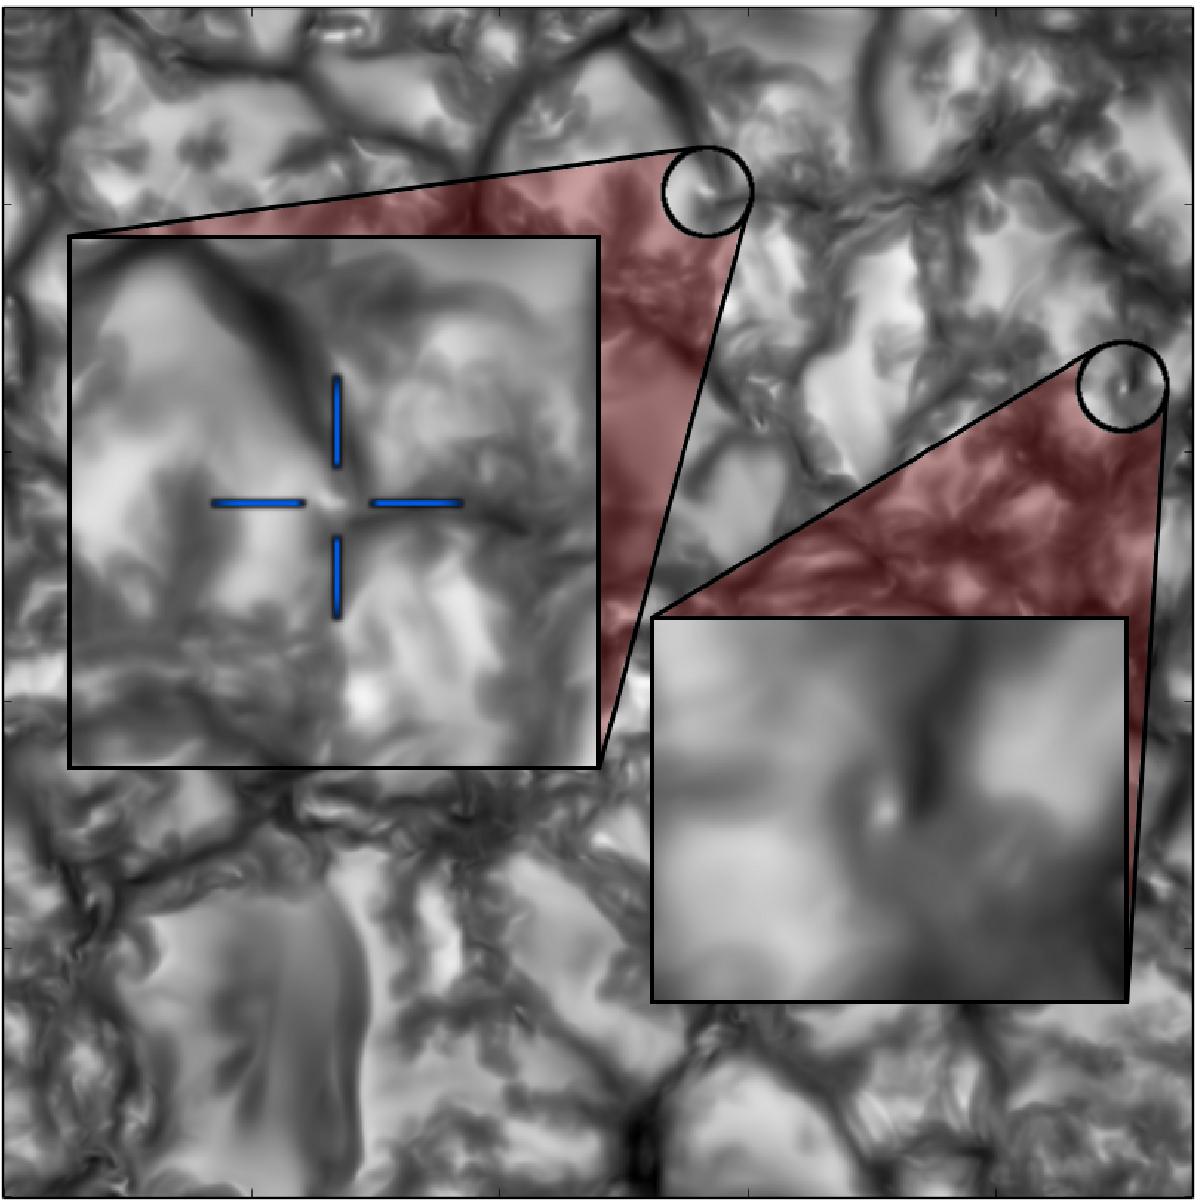
Bolometric intensity map of the non-magnetic simulation of a field of view of 9.6 × 9.6 Mm2. The nMBP in the close-up on the left has a diameter of 80 km (resolved by approximately 8 × 8 computational cells). It has an intensity contrast of 35% with respect to the immediate neighbourhood but only 5% with respect to the global average intensity. A second nMBP is visible in the close-up on the lower right. Vertical sections along the blue lines in the close-up on the left are shown in Fig. 2. This figure is accompanied by a movie.
Current usage metrics show cumulative count of Article Views (full-text article views including HTML views, PDF and ePub downloads, according to the available data) and Abstracts Views on Vision4Press platform.
Data correspond to usage on the plateform after 2015. The current usage metrics is available 48-96 hours after online publication and is updated daily on week days.
Initial download of the metrics may take a while.