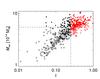
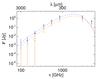
Fig. 5
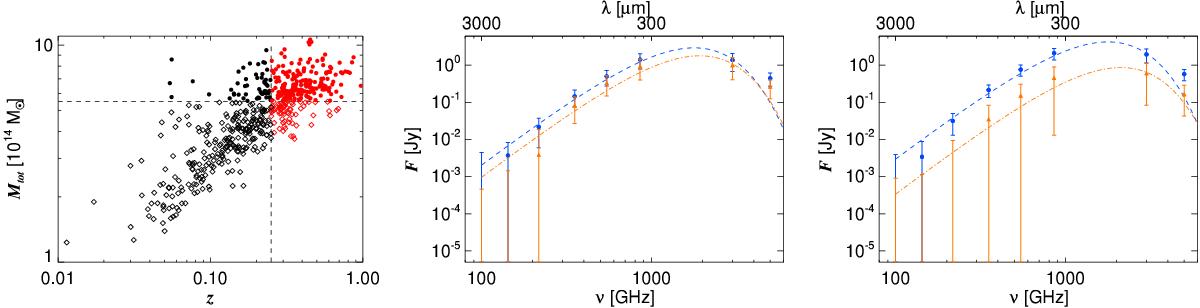
SEDs for cluster sub-samples. Left: in the redshift−mass plane, we show the distribution of the 561 Planck clusters with known redshift, which are used in this paper. Different colours (black and red) are used for the low- and high-redshift sub-samples, while different symbols (dots and diamonds) are used for the low- and high-mass sub-samples. Middle: in blue circles the 254 clusters at z> 0.25 and in orange triangles the 307 clusters at z ≤ 0.25 (307 clusters), plotted along with the corresponding best-fit models (dashed and dash-dotted lines, respectively). Left: in blue the 241 clusters with Mtot> 5.5 × 10¹⁴M⊙ and in orange the 320 clusters with Mtot ≤ 5.5 × 10¹⁴M⊙, along with the best-fit models (dashed and dash-dotted lines, respectively). The rightmost (IRAS) point is not used in the fit.
Current usage metrics show cumulative count of Article Views (full-text article views including HTML views, PDF and ePub downloads, according to the available data) and Abstracts Views on Vision4Press platform.
Data correspond to usage on the plateform after 2015. The current usage metrics is available 48-96 hours after online publication and is updated daily on week days.
Initial download of the metrics may take a while.