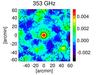
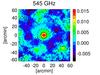
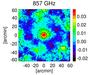
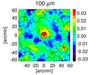
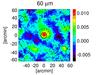
Fig. 2
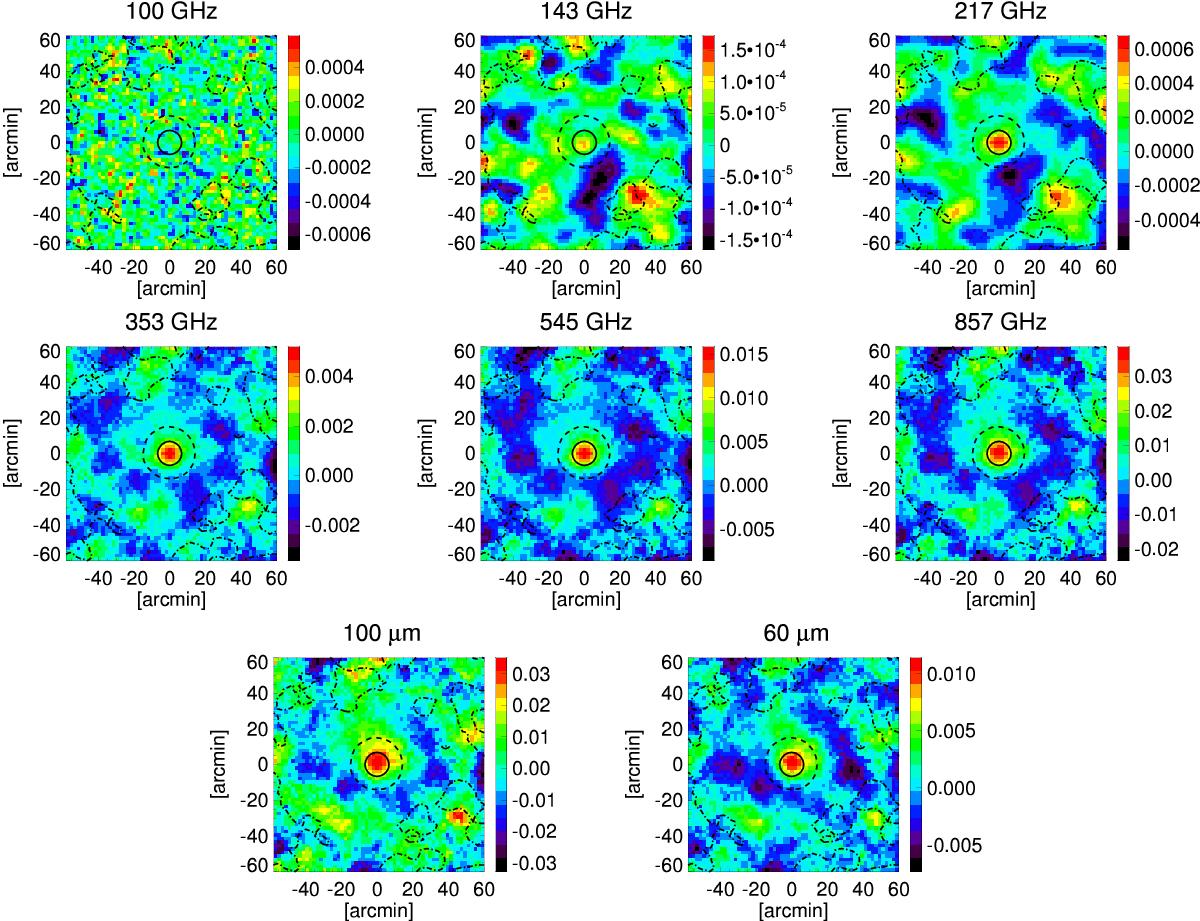
Background- and foreground-cleaned stacked maps, for the final sample of 645 clusters. The units here are MJy sr-1. The extent of the stacked y-signal is represented by black contours for regions of 0.5, 0.1, and 0 times the maximum of the signal (in solid, dashed, and dot-dashed lines, respectively). See Sect. 3.2 for further details.
Current usage metrics show cumulative count of Article Views (full-text article views including HTML views, PDF and ePub downloads, according to the available data) and Abstracts Views on Vision4Press platform.
Data correspond to usage on the plateform after 2015. The current usage metrics is available 48-96 hours after online publication and is updated daily on week days.
Initial download of the metrics may take a while.