Fig. 10
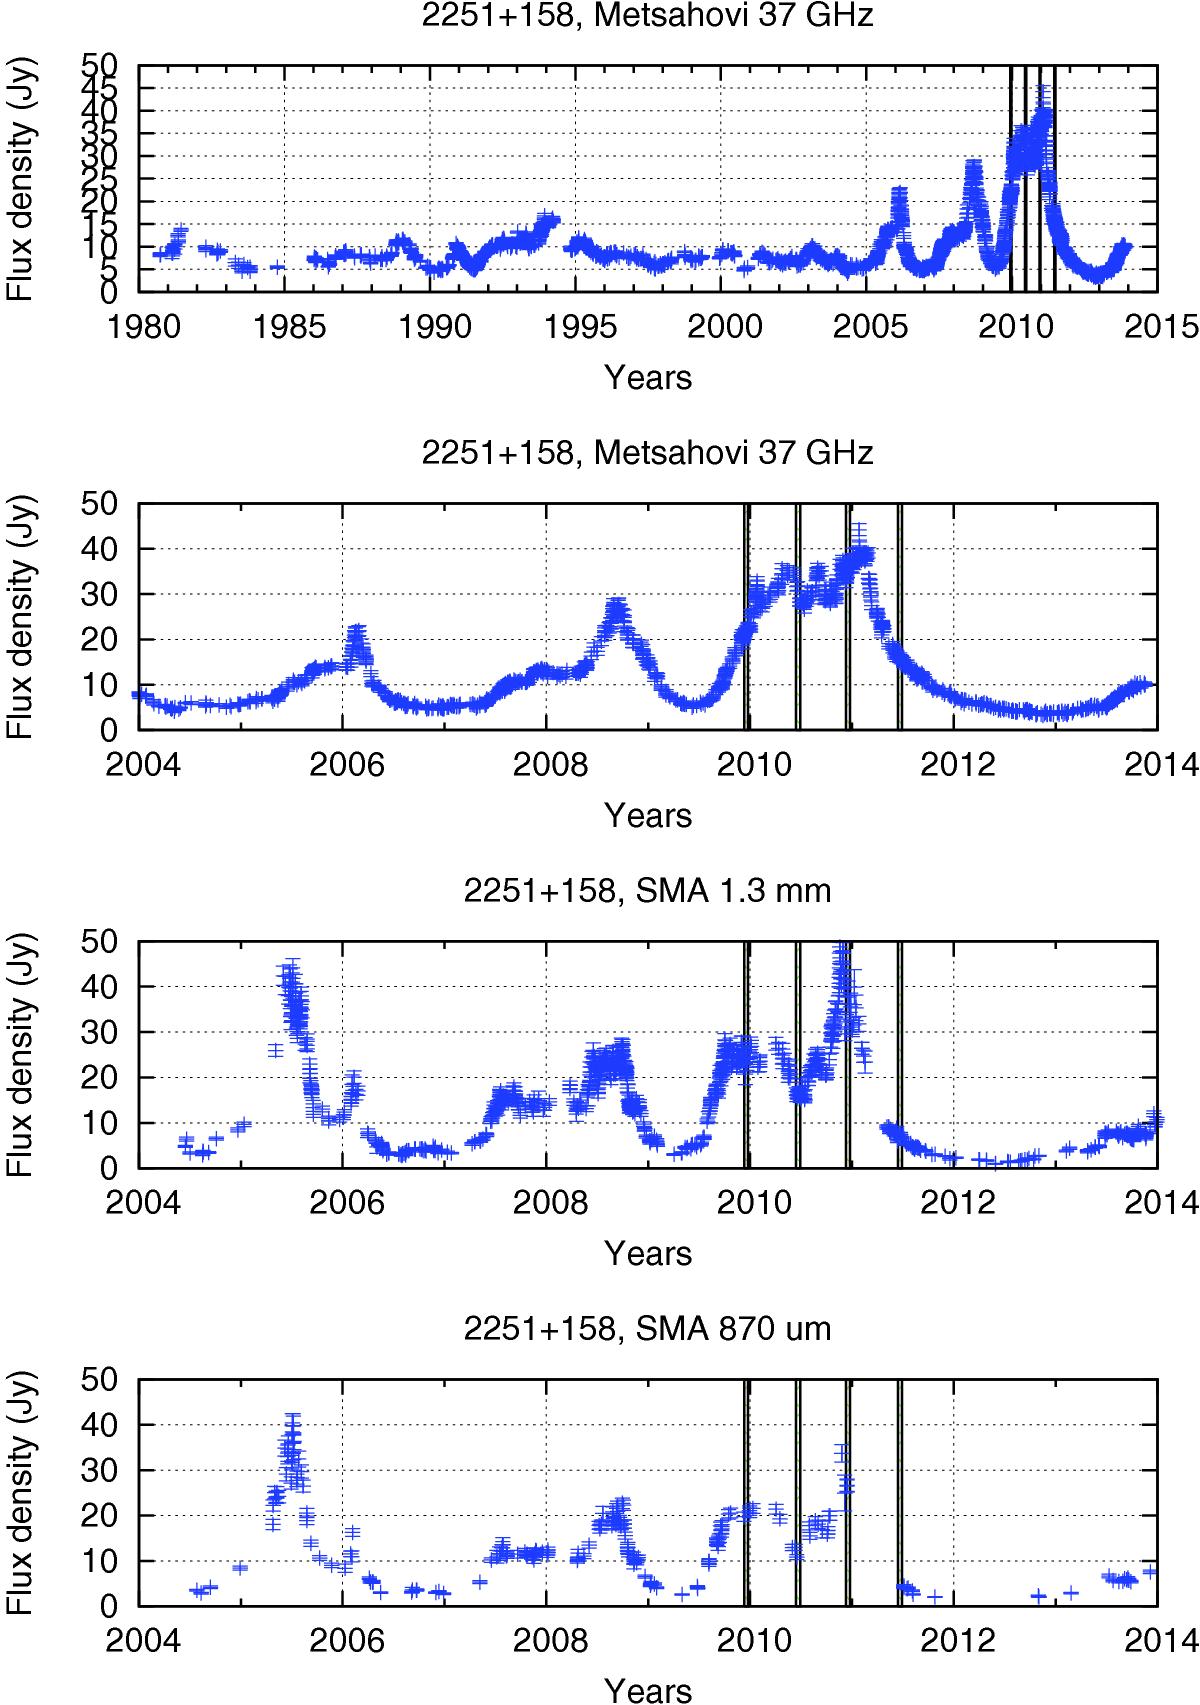
Flux density curves for 2251+158 at 37 GHz (Metsähovi), 1.3 mm, and 870 μm (SMA). See Fig. 6 for details. A large part of the SMA data has been published; see Raiteri et al. (2008, 2011), Villata et al. (2009), Jorstad et al. (2010, 2013), Pacciani et al. (2010), Vercellone et al. (2010, 2011), Ogle et al. (2011), Wehrle et al. (2012). Some data come from a dedicated programme by Ann Wehrle.
Current usage metrics show cumulative count of Article Views (full-text article views including HTML views, PDF and ePub downloads, according to the available data) and Abstracts Views on Vision4Press platform.
Data correspond to usage on the plateform after 2015. The current usage metrics is available 48-96 hours after online publication and is updated daily on week days.
Initial download of the metrics may take a while.