Fig. 3
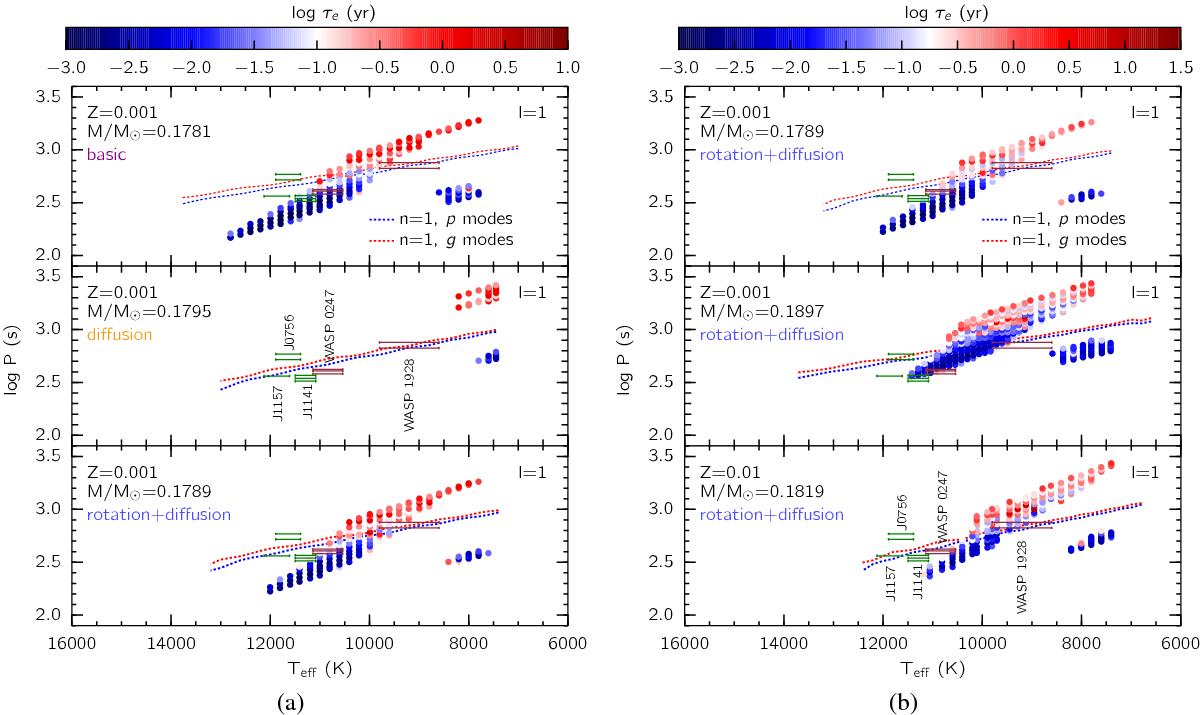
Calculated period spectrum for the excited modes for each of the retained models represented by the gray circles in Fig. 1. The color code indicates the logarithm of the e-folding time, τe. The blue dotted curve defines the upper limit (radial order n = 1) of the p-mode spectrum, while the red dotted curve corresponds to the lower limit (radial order n = 1) of the g-mode spectrum. The green (magenta) lines denote the three observed mixed-atmosphere pulsators (two WASP pulsators). Left panel: comparison between the basic, diffusion, and diffusion+rotation for roughly the same WD mass; right panel: comparison of different WD masses and metallicities in the rotation+diffusion configuration.
Current usage metrics show cumulative count of Article Views (full-text article views including HTML views, PDF and ePub downloads, according to the available data) and Abstracts Views on Vision4Press platform.
Data correspond to usage on the plateform after 2015. The current usage metrics is available 48-96 hours after online publication and is updated daily on week days.
Initial download of the metrics may take a while.