Fig. 4
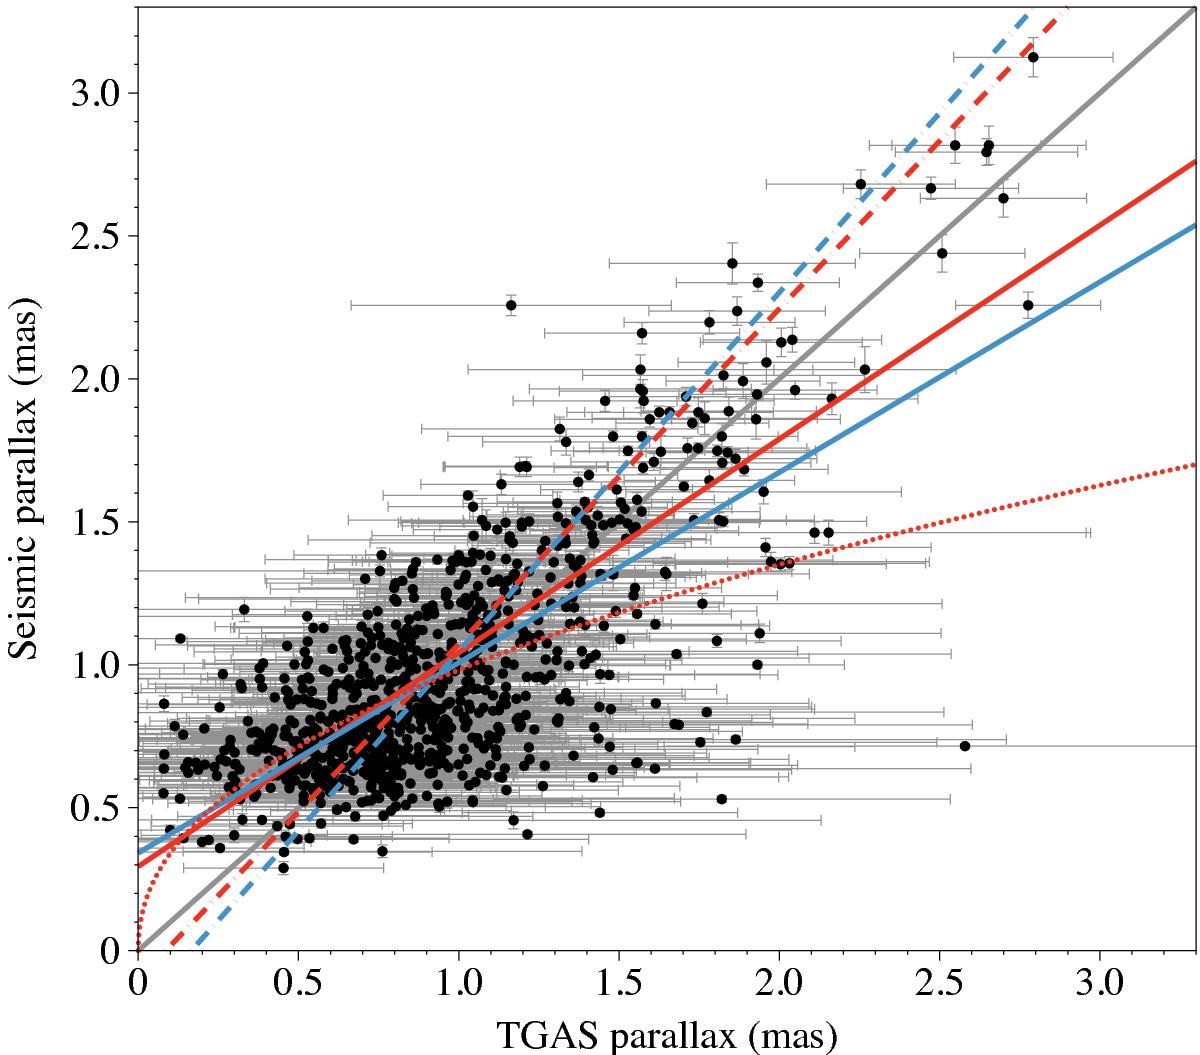
Seismic vs. TGAS parallaxes for the sample of 938 analysed red giant pulsators. The thick grey line is the bisector. Red lines: fits from an errors-in-variables model where the uncertainties on both parallaxes were taken into account; blue lines: fits obtained without taking any uncertainties into account. Solid lines are a fit using the linear model Si = α + βϖi. Dashed lines are a fit using the model ϖi = κ + ρSi. The curved dotted line is a fit using the model log Di = 3 + αl−(1 + βl)log ϖi.
Current usage metrics show cumulative count of Article Views (full-text article views including HTML views, PDF and ePub downloads, according to the available data) and Abstracts Views on Vision4Press platform.
Data correspond to usage on the plateform after 2015. The current usage metrics is available 48-96 hours after online publication and is updated daily on week days.
Initial download of the metrics may take a while.