Free Access
Fig. 3
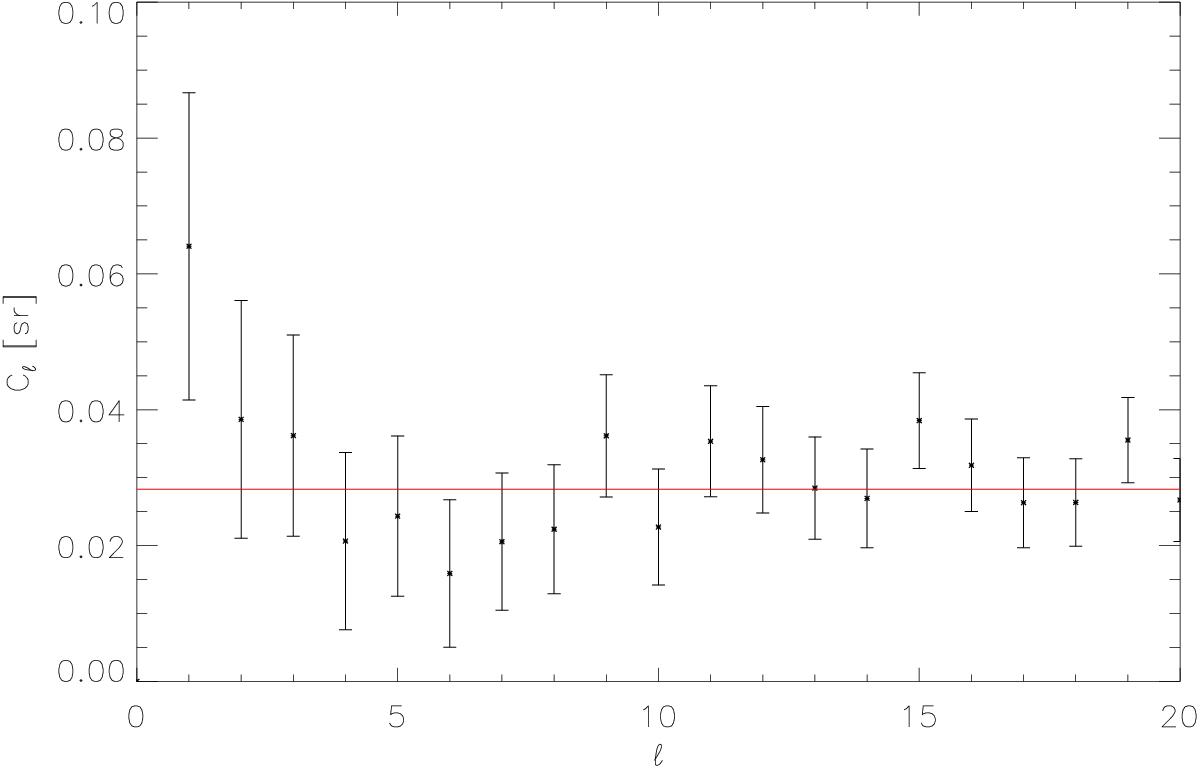
X-SZ cross-correlation amplitude, AXSZ, power spectrum. The black sample presents the measured power spectrum from MILCA and RASS full-sky maps, the red line shows the prediction when isotropy is satisfied.
Current usage metrics show cumulative count of Article Views (full-text article views including HTML views, PDF and ePub downloads, according to the available data) and Abstracts Views on Vision4Press platform.
Data correspond to usage on the plateform after 2015. The current usage metrics is available 48-96 hours after online publication and is updated daily on week days.
Initial download of the metrics may take a while.