Fig. 5
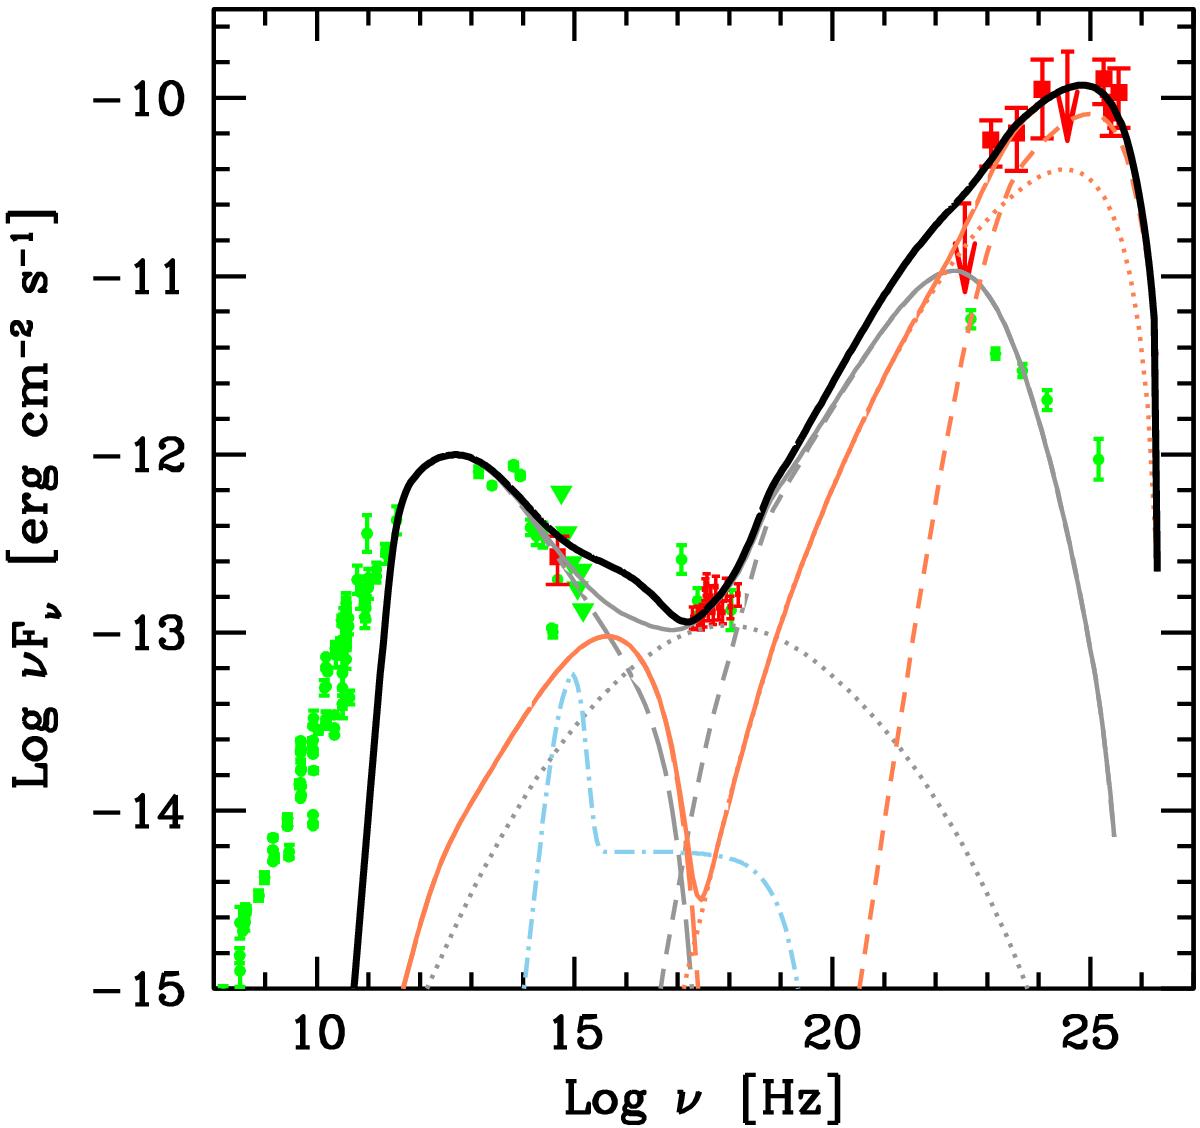
Broadband SED of QSO B0218+357 modeled with a two-zone model. The reconstructed fluxes (red squares) are corrected for different magnifications in different energy ranges (see the text). Historical measurements (ASDC7) are shown with green circles and triangles (flux upper limit). Gray curves depict the emission from the region located within the BLR, while orange curves refer to the region located beyond the BLR. Long dashed curves show the synchrotron radiation, dotted the SSC emission and short dashed the external Compton emission. Dashed-dotted light blue line represents the accretion disk emission and its X-ray corona. The solid black line shows the sum of the non-thermal emission from both regions.
Current usage metrics show cumulative count of Article Views (full-text article views including HTML views, PDF and ePub downloads, according to the available data) and Abstracts Views on Vision4Press platform.
Data correspond to usage on the plateform after 2015. The current usage metrics is available 48-96 hours after online publication and is updated daily on week days.
Initial download of the metrics may take a while.