Fig. 4
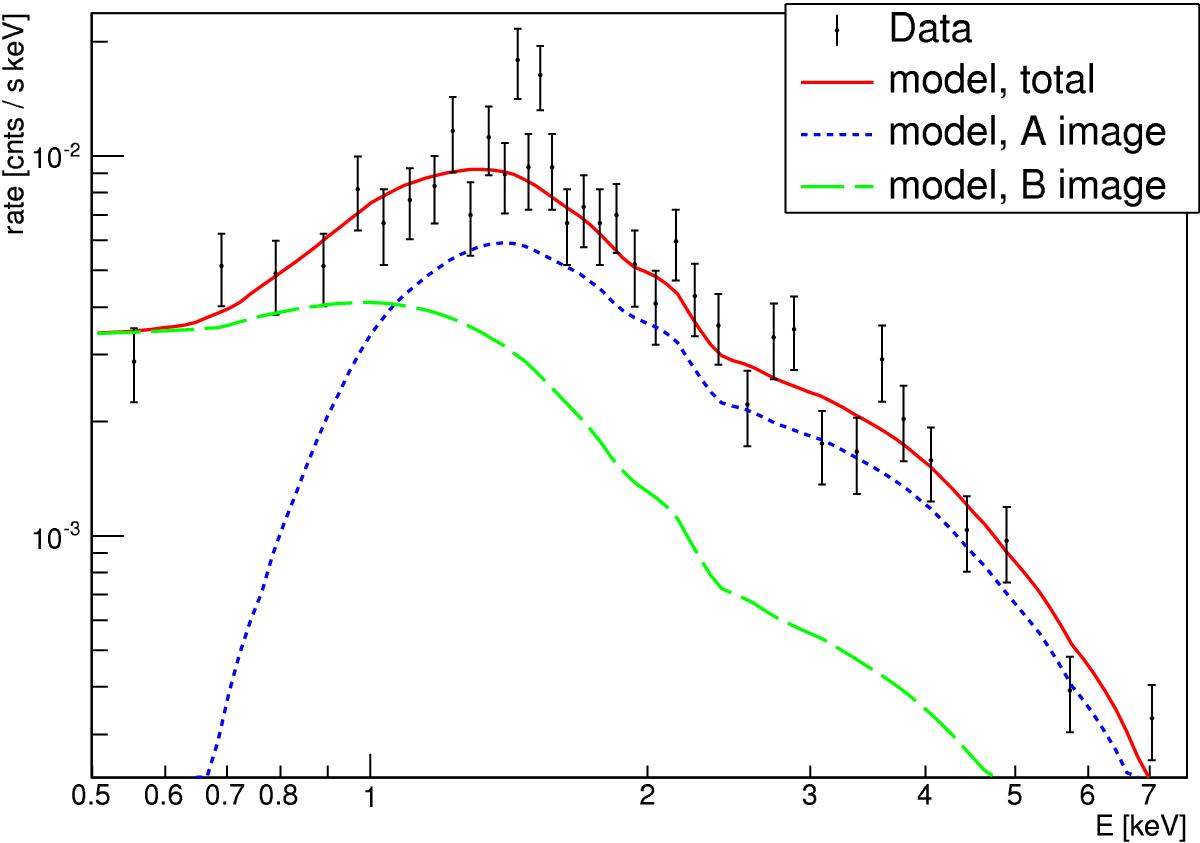
Energy-binned counts observed by Swift-XRT from the direction of QSO B0218+357 (data points). The emission is modeled as a sum (solid red line) of two power-law components with the same spectral index. The first component (A image) is magnified by a factor 2.7 with an additional strong hydrogen absorption at the lens (dotted blue line). The second component (B image) is intrinsically weaker (magnification factor 0.7), but not absorbed at the lens (dashed green line).
Current usage metrics show cumulative count of Article Views (full-text article views including HTML views, PDF and ePub downloads, according to the available data) and Abstracts Views on Vision4Press platform.
Data correspond to usage on the plateform after 2015. The current usage metrics is available 48-96 hours after online publication and is updated daily on week days.
Initial download of the metrics may take a while.