Fig. 3
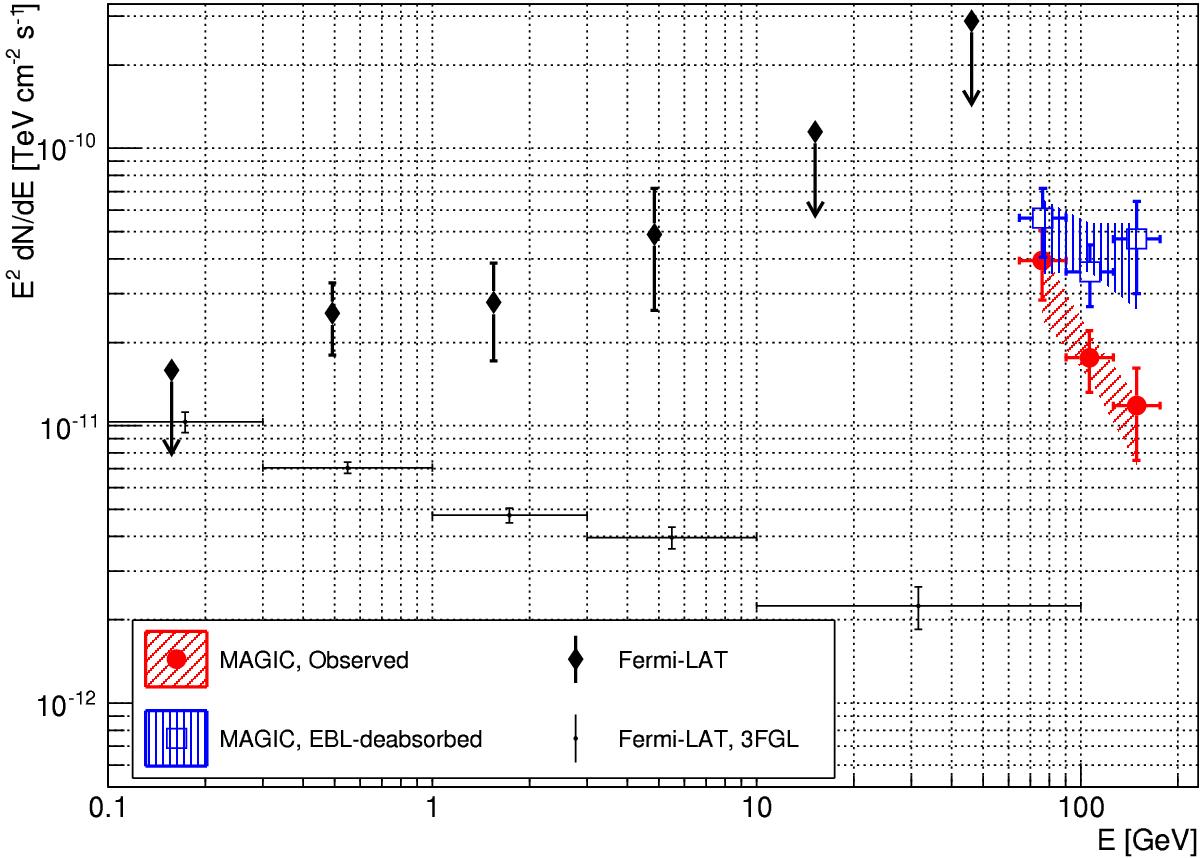
Gamma-ray SED of QSO B0218+357 as observed during the two flaring nights, 2014 July 25 and 26, by MAGIC (red filled circles) and after deabsorption in EBL according to the Domínguez et al. (2011) model (blue open squares). The shaded regions show the 1 standard deviation of the power-law fit to the MAGIC data. Black diamonds show the Fermi-LAT spectrum from the same time period. Black points show the average emission of QSO B0218+357 in the 3FGL catalog (Acero et al. 2015).
Current usage metrics show cumulative count of Article Views (full-text article views including HTML views, PDF and ePub downloads, according to the available data) and Abstracts Views on Vision4Press platform.
Data correspond to usage on the plateform after 2015. The current usage metrics is available 48-96 hours after online publication and is updated daily on week days.
Initial download of the metrics may take a while.