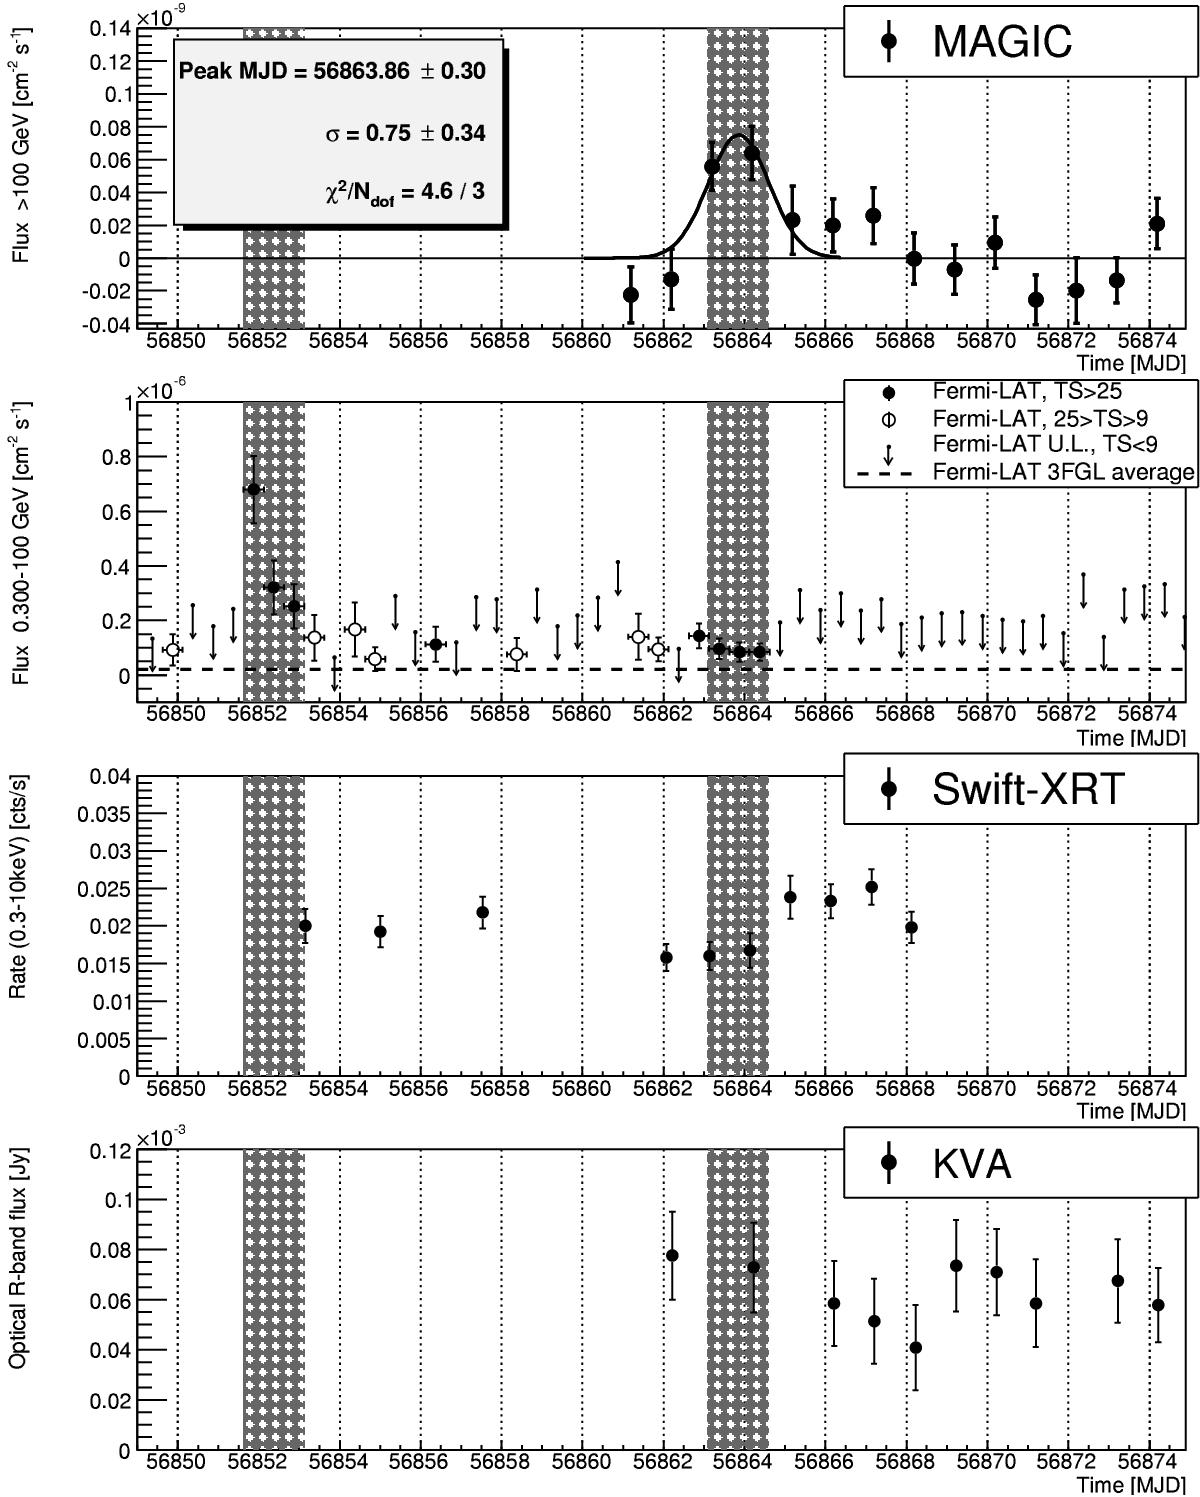
Fig. 2

Light curve of QSO B0218+357 during the flaring state in July/August 2014. Top panel: MAGIC (points) above 100 GeV and a Gaussian fit to the peak position (thick solid line). Second panel from the top: Fermi-LAT above 0.3 GeV with the average flux from the 3rd Fermi Catalog (Acero et al. 2015) marked with a dashed line. Notice that, during the days where the trailing emission was expected Fermi-LAT was in pointing mode allowing the significant detection of lower flux levels. Third panel from the top: Swift-XRT count rate in the 0.3–10 keV range. Bottom panel: KVA in R band (not corrected for the contribution of host/lens galaxies and the Galactic extinction). The two shaded regions are separated by 11.46 days.
Current usage metrics show cumulative count of Article Views (full-text article views including HTML views, PDF and ePub downloads, according to the available data) and Abstracts Views on Vision4Press platform.
Data correspond to usage on the plateform after 2015. The current usage metrics is available 48-96 hours after online publication and is updated daily on week days.
Initial download of the metrics may take a while.


