Fig. 7
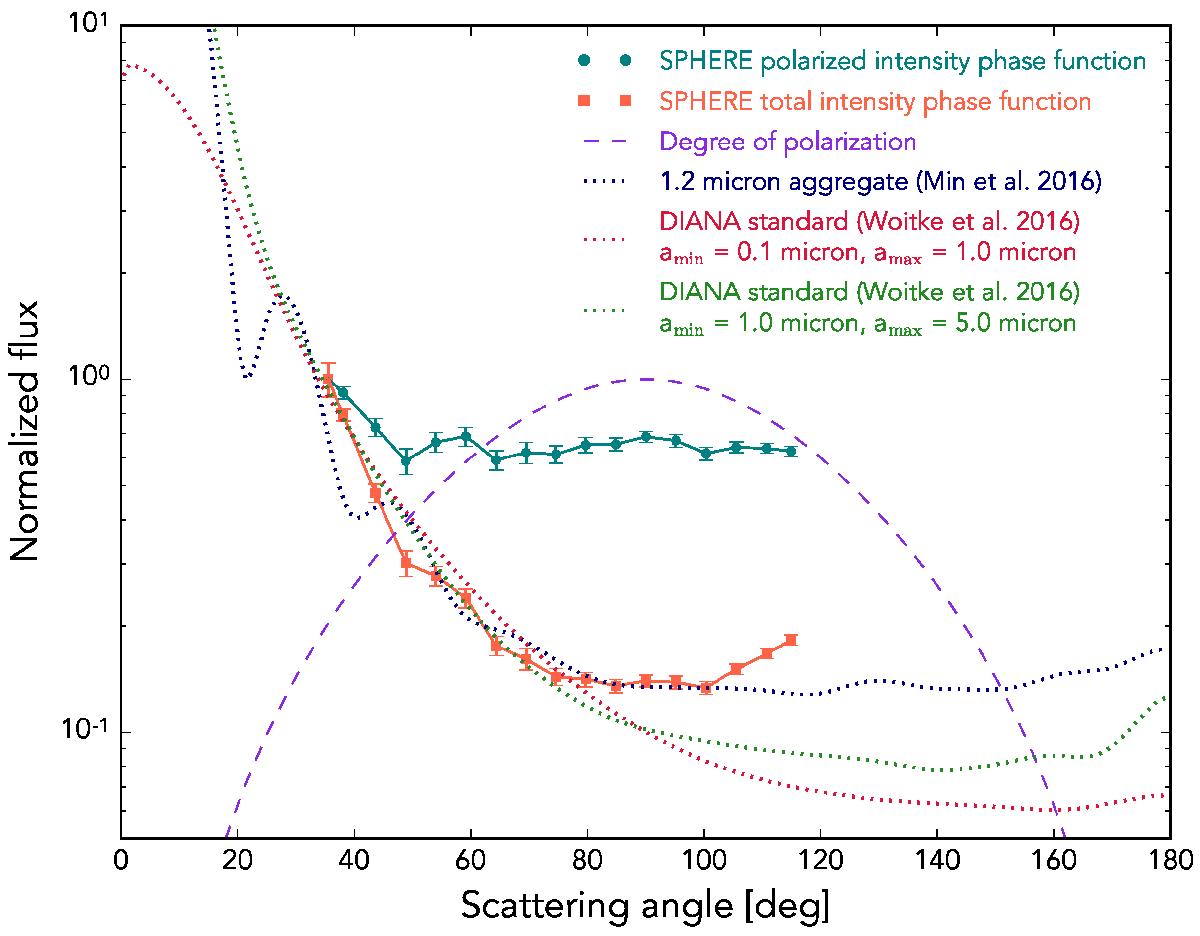
Polarized intensity phase function (green data points) and reconstructed total intensity phase function (red data points) obtained from the SPHERE Qφ image. The phase functions have been normalized to their peak value and the error bars show 1σ uncertainties determined from the Uφ image. A bell-shaped degree of polarization (purple dashed line) was used to reconstruct the total intensity phase function. The dotted lines show numerically calculated phase functions in J band for DIANA standard dust opacities (Woitke et al. 2016) and a compact dust aggregate (Min et al. 2016).
Current usage metrics show cumulative count of Article Views (full-text article views including HTML views, PDF and ePub downloads, according to the available data) and Abstracts Views on Vision4Press platform.
Data correspond to usage on the plateform after 2015. The current usage metrics is available 48-96 hours after online publication and is updated daily on week days.
Initial download of the metrics may take a while.