Fig. 1
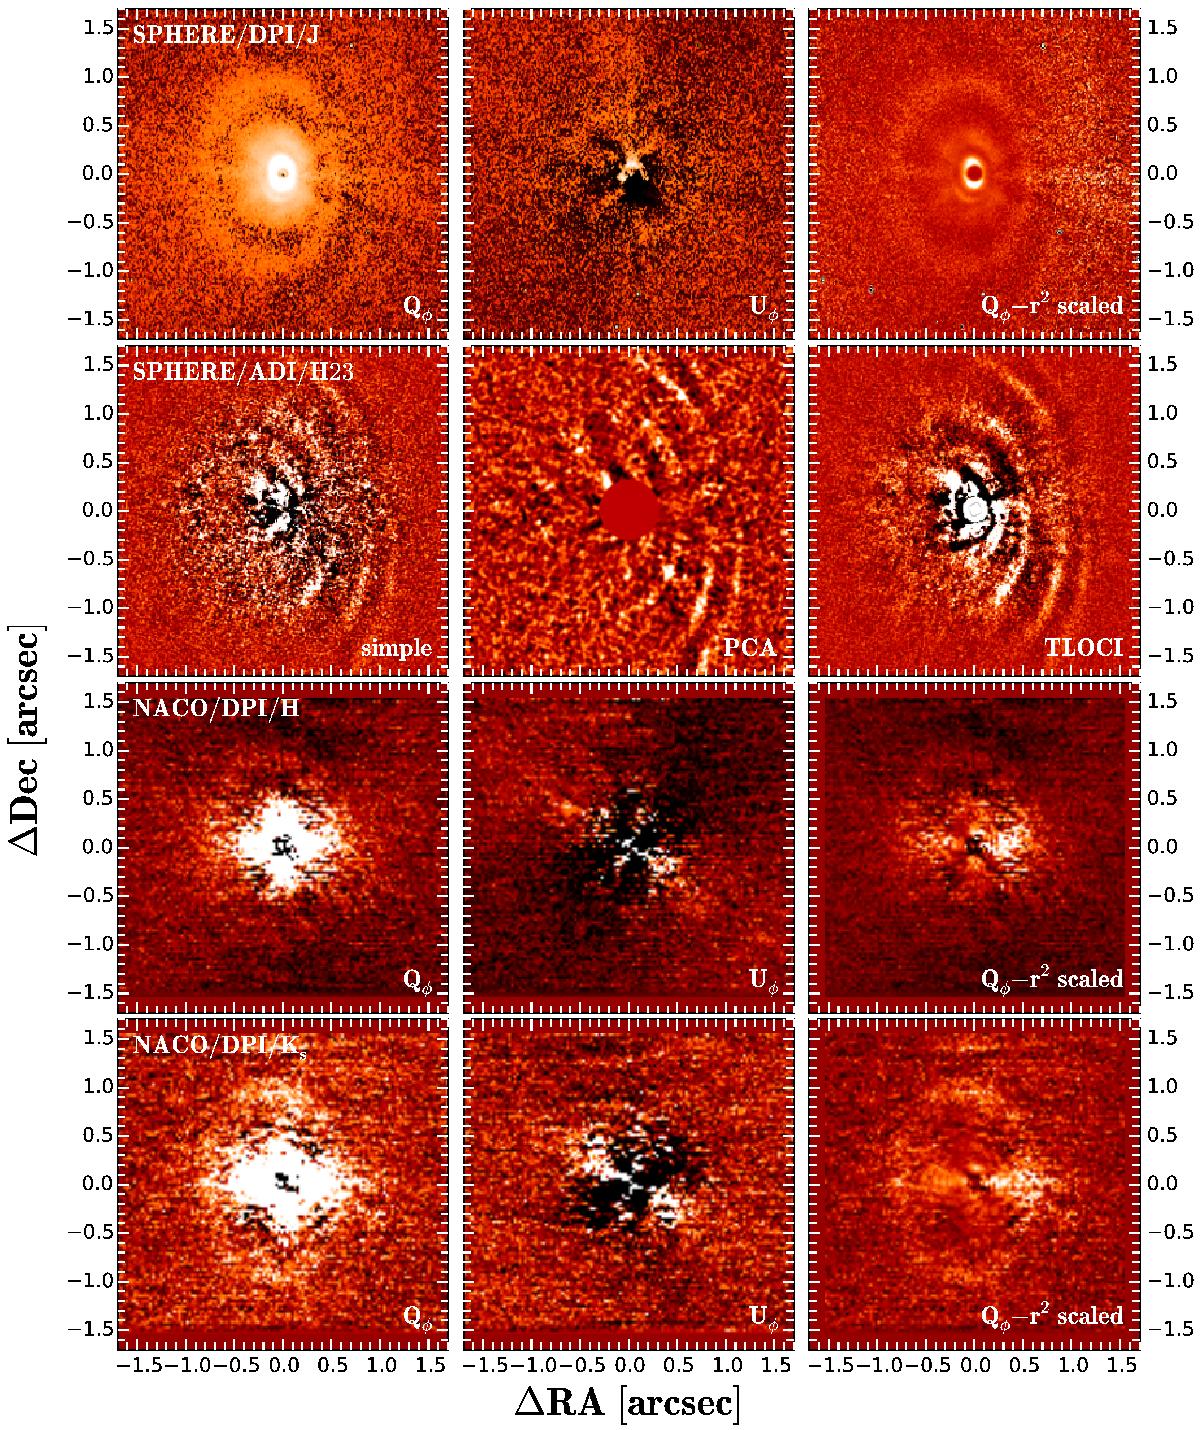
First row: left and middle: reduced SPHERE DPI Qφ and Uφ images. Colour scale and stretch are the same for both images. North is up and east to the left. We have some residual signals in Uφ close to the centre of the image which can be explained by imperfect centring of the coronagraphic data or by multiple scattering in the inner disk. First row: right: Qφ scaled with the square of the separation from the central star to account for the r2 dependency of the scattered light flux (see Sect. 3.3). Second row: SPHERE ADI images of the system reduced with three different algorithms (simple ADI, PCA, and TLOCI). In all cases, the H2- and H3-band images were combined to increase the signal. Third and fourth row: left and middle: NACO H- and Ks-band Qφ and Uφ images re-reduced by our team. Ring 2 and Gap 2 are clearly detected in Ks band. Third and fourth row: right: r2-scaled Qφ NACO image analogous to the corresponding SPHERE image.
Current usage metrics show cumulative count of Article Views (full-text article views including HTML views, PDF and ePub downloads, according to the available data) and Abstracts Views on Vision4Press platform.
Data correspond to usage on the plateform after 2015. The current usage metrics is available 48-96 hours after online publication and is updated daily on week days.
Initial download of the metrics may take a while.