Fig. 8
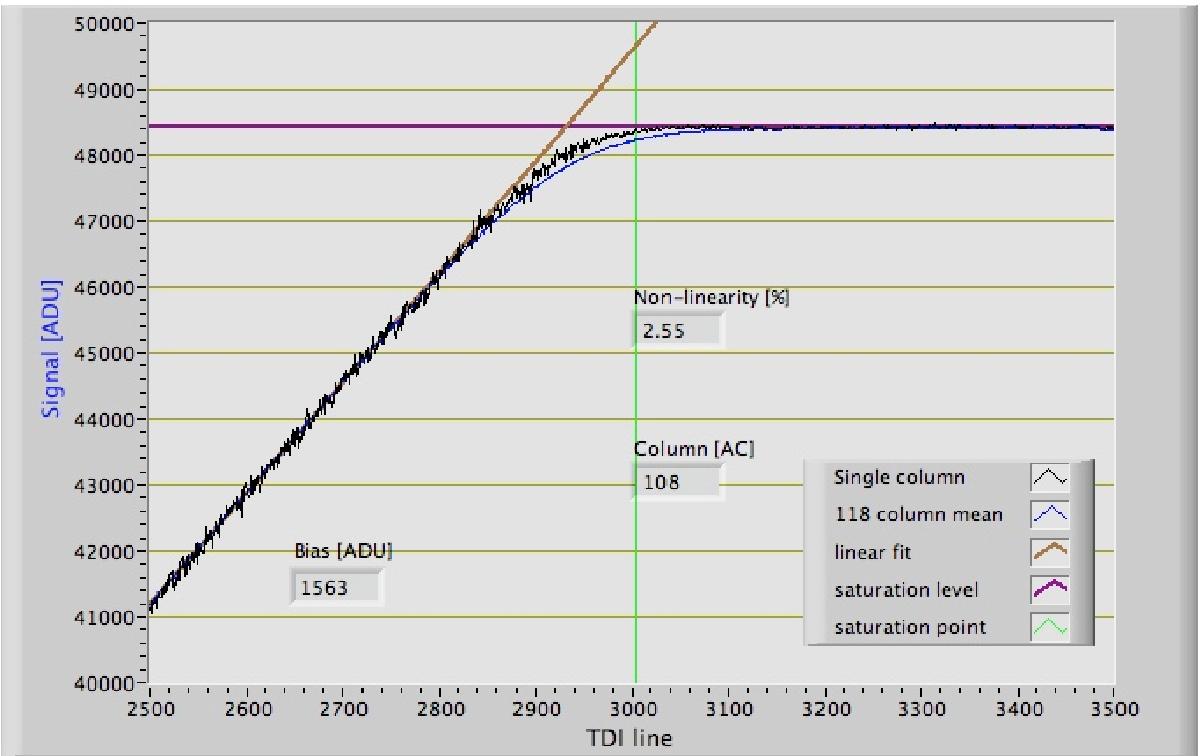
Single column response to linear increase of illumination level per TDI line. The black lines represent the data points of single pixel samples from column 108. The blue curve represents the mean response of all columns analysed. The vertical green lines mark the saturation point for the column, defined as the TDI line, at which the signal enters the 3σ zone around the mean saturation level. The mean value of non-linearity (deviation from expected linear response) for all 118 columns used in this test is 2.82 ± 0.48%. The plotted column has a non-linearity equal to 2.55%. Plot courtesy of Ralph Kohley, Astrium and MSSL.
Current usage metrics show cumulative count of Article Views (full-text article views including HTML views, PDF and ePub downloads, according to the available data) and Abstracts Views on Vision4Press platform.
Data correspond to usage on the plateform after 2015. The current usage metrics is available 48-96 hours after online publication and is updated daily on week days.
Initial download of the metrics may take a while.