Fig. 7
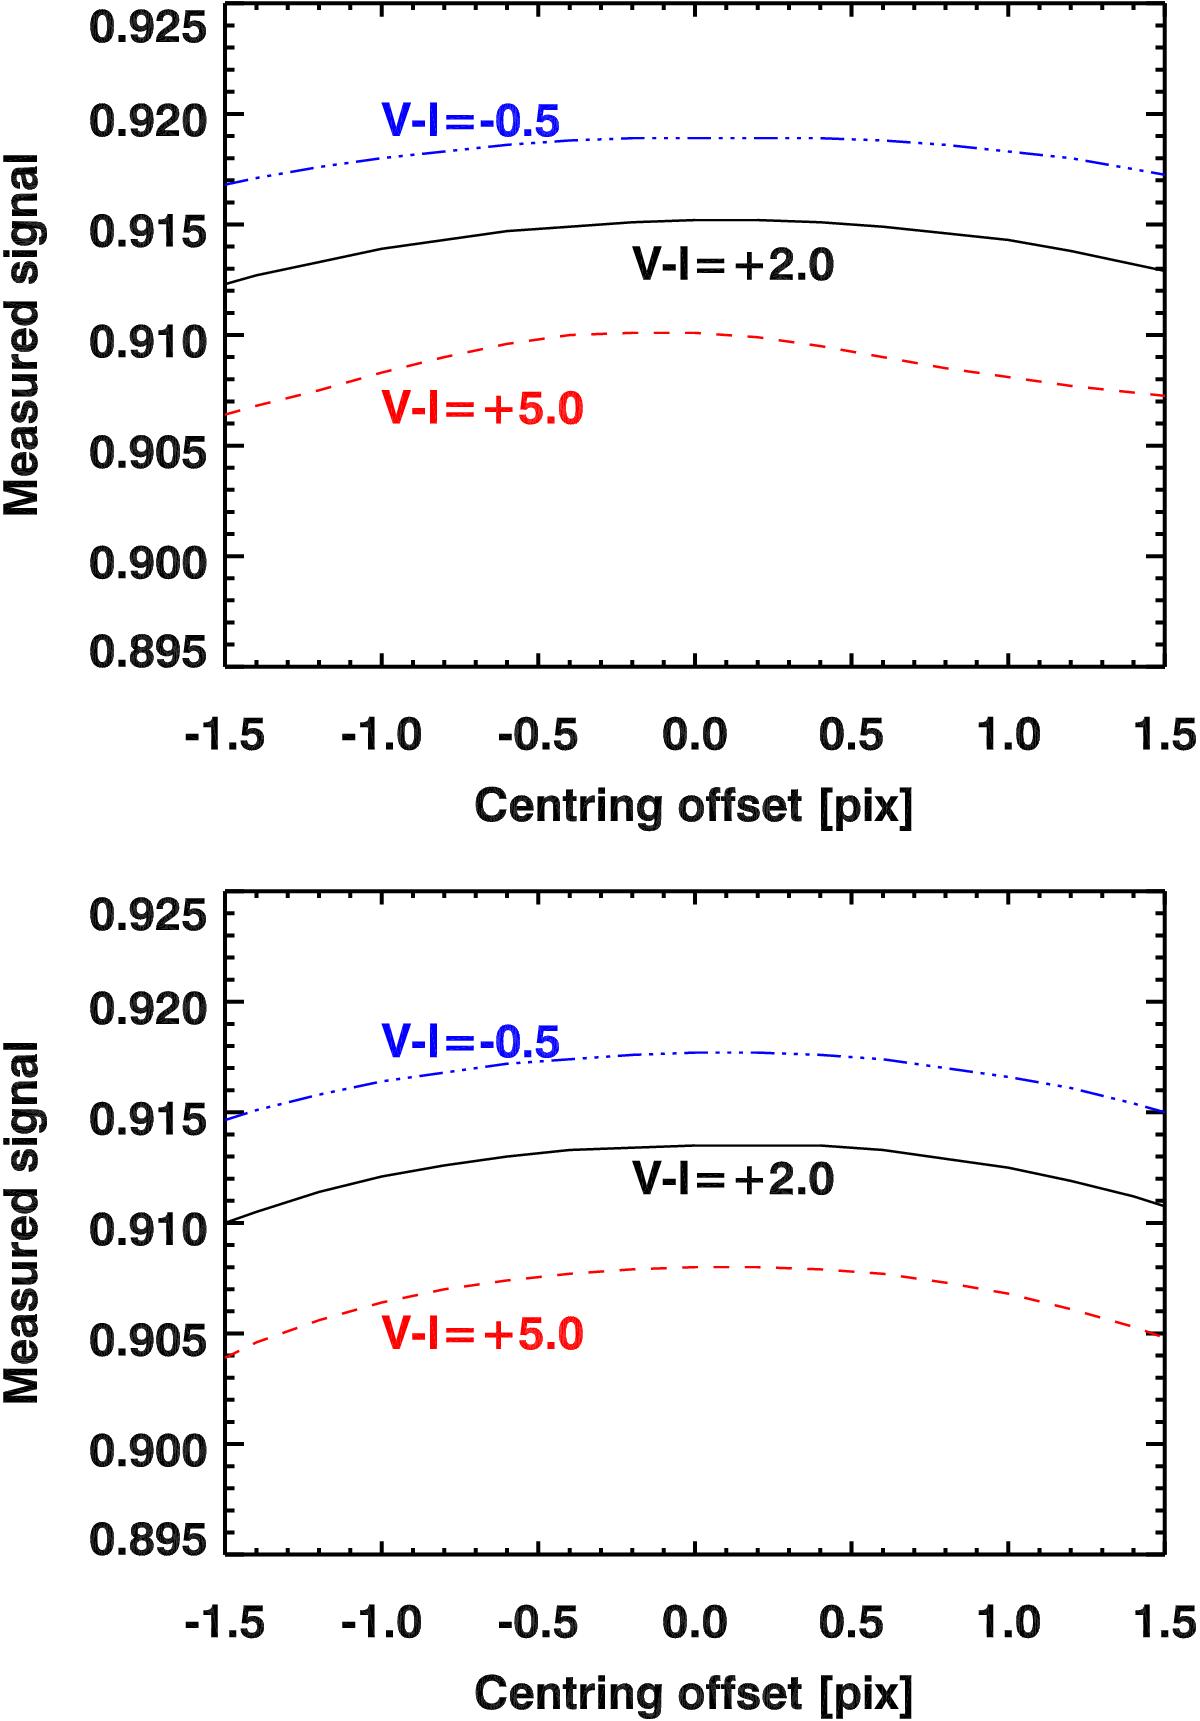
Fraction of measured flux in the CCD for strip 9, row 1 and FoV 2 in AF is plotted as a function of the centering offset with no AC motion (top) and maximal AC motion (bottom). For assumed maximal centering offsets of about one pixel the dependence on the colour V−I of the source is the dominating effect for AC flux loss with variations up to 1.1 percent.
Current usage metrics show cumulative count of Article Views (full-text article views including HTML views, PDF and ePub downloads, according to the available data) and Abstracts Views on Vision4Press platform.
Data correspond to usage on the plateform after 2015. The current usage metrics is available 48-96 hours after online publication and is updated daily on week days.
Initial download of the metrics may take a while.