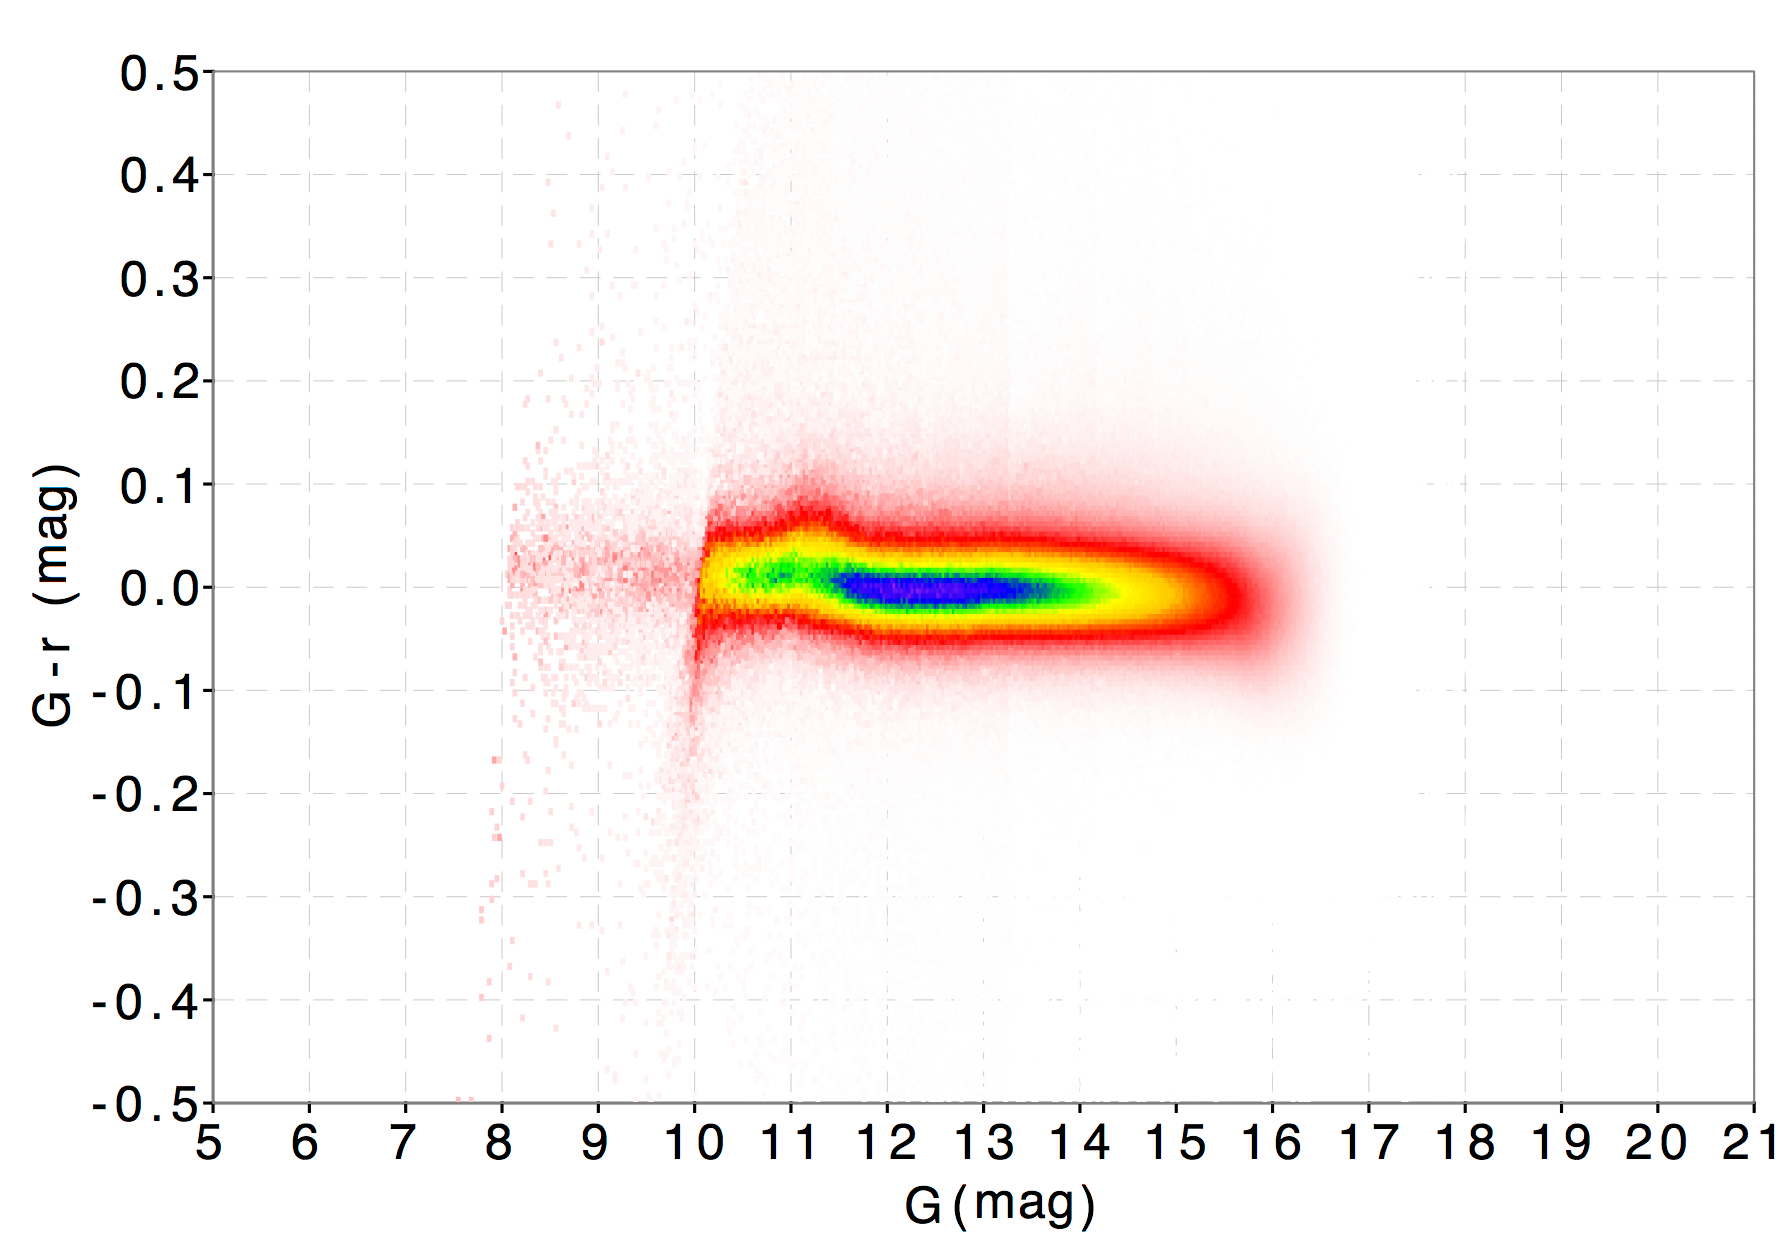
Fig. 11
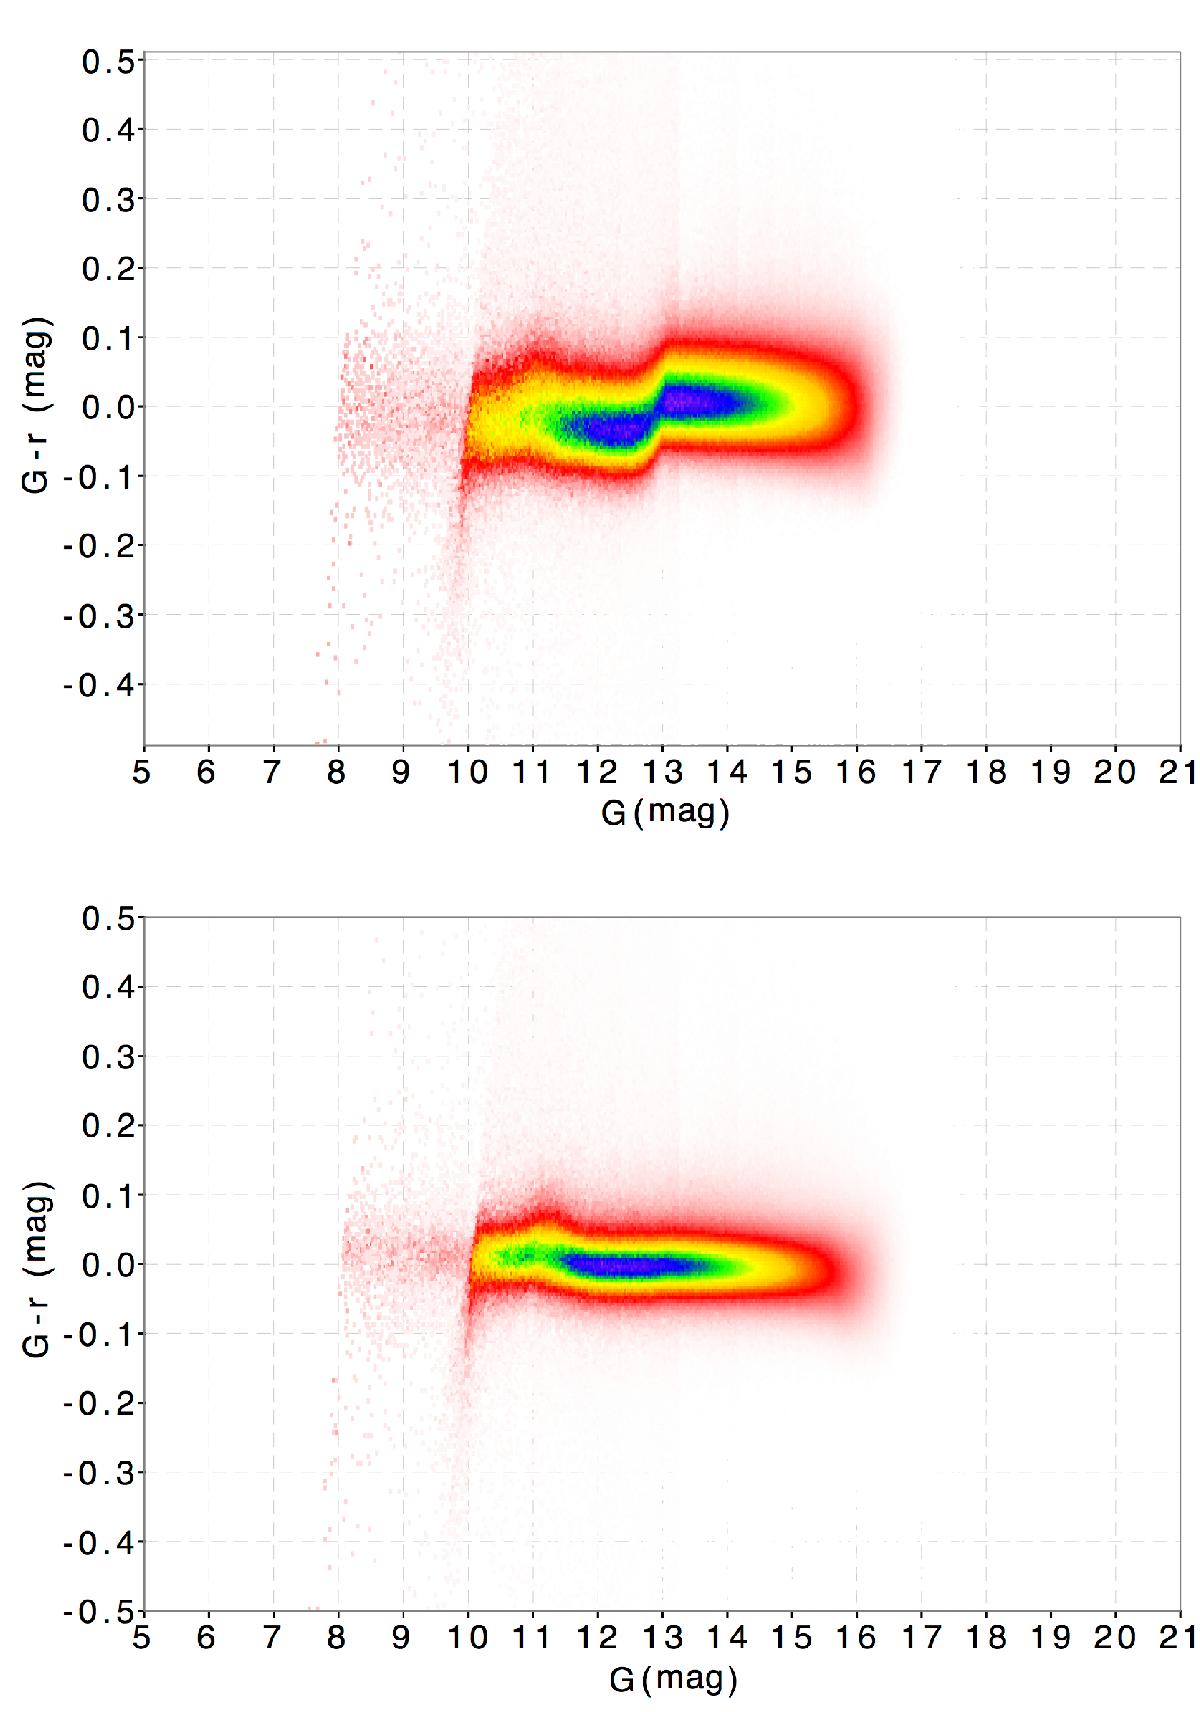
Comparison between mean data derived from Gaia observations and photometry from the APASS catalogue (Henden et al. 2009) for raw (uncalibrated) transits before (top) and after (bottom) the gate/WC link calibration for a narrow range of colour. The Galactic plane is excluded to minimize extinction effects. The jump at G = 13 in the top panel (and corrected in the bottom panel) is expected and due to the aperture correction effect not taken into account for faint sources observed in 1D (see Sect. 3). The slight bump at G = 11 is due to saturation and gating effects.
Current usage metrics show cumulative count of Article Views (full-text article views including HTML views, PDF and ePub downloads, according to the available data) and Abstracts Views on Vision4Press platform.
Data correspond to usage on the plateform after 2015. The current usage metrics is available 48-96 hours after online publication and is updated daily on week days.
Initial download of the metrics may take a while.