Fig. 9
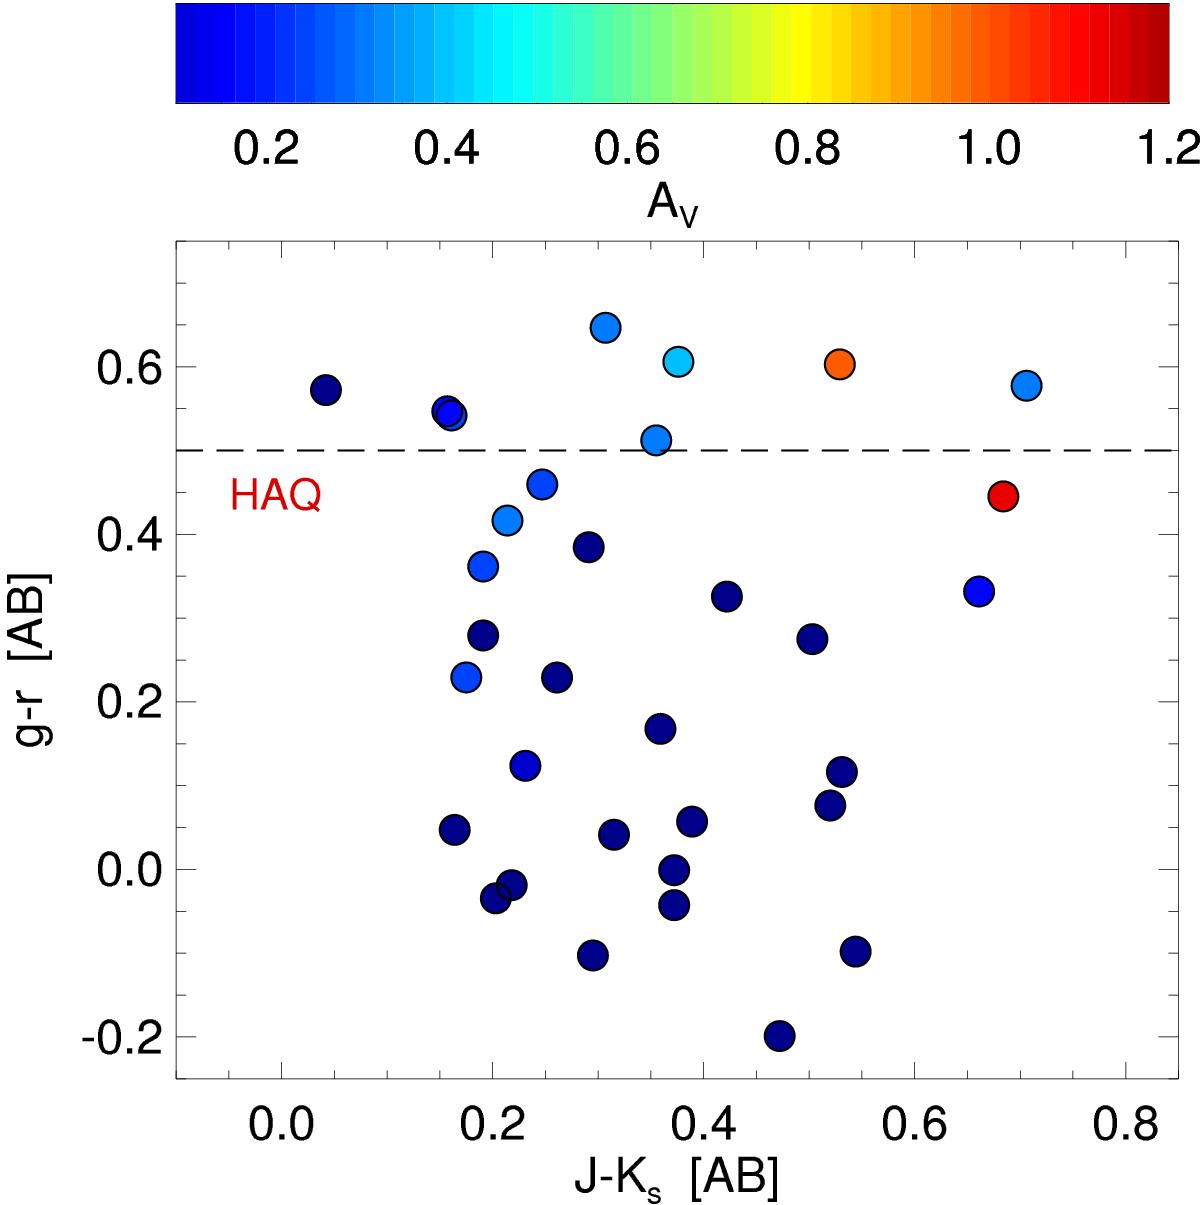
Optical/NIR color−color diagram of the 33 quasars from the parent sample, color-coded as a function of their reddening, AV (see the top legend). The HAQ g−r color cut is shown by the dashed line. This conservative cut yields a reliable sample of reddened quasars only, while more relaxed color criteria are needed to obtain a more complete sample of reddened quasars, see also Fig. 5 (middle and right panel).
Current usage metrics show cumulative count of Article Views (full-text article views including HTML views, PDF and ePub downloads, according to the available data) and Abstracts Views on Vision4Press platform.
Data correspond to usage on the plateform after 2015. The current usage metrics is available 48-96 hours after online publication and is updated daily on week days.
Initial download of the metrics may take a while.