Fig. 2
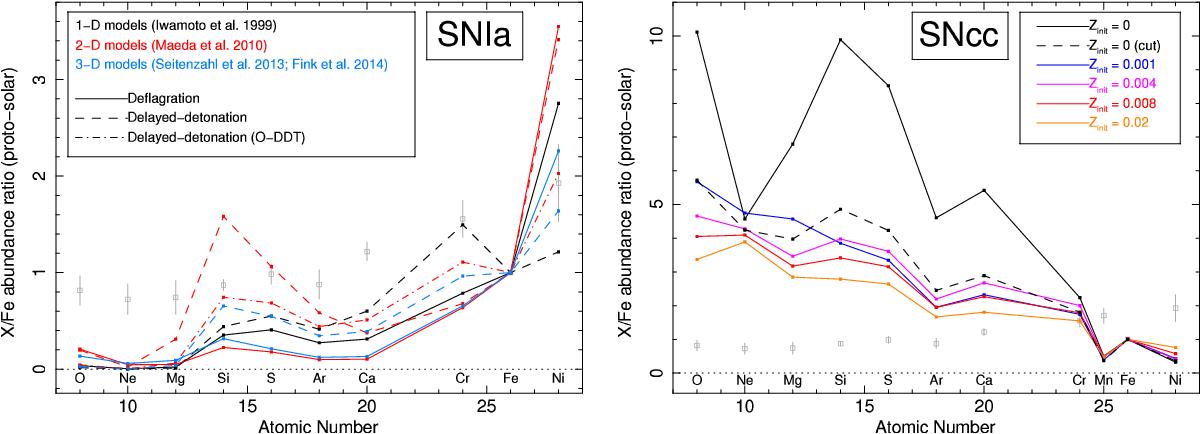
Predicted X/Fe abundances from various SNIa and SNcc yield models. For comparison, the ICM average abundance ratios (inferred from Paper I) are also plotted. Left: SNIa yield models: 1D (W7 and WDD2 from Iwamoto et al. 1999), 2D (C-DEF, C-DDT, and O-DDT from Maeda et al. 2010), and 3D (N100def and N100 from Fink et al. (2014) and Seitenzahl et al. (2013b), respectively) models are indicated in back, red, and blue, respectively. A distinction is also made between the explosion models: deflagration (W7, C-DEF, and N100def; solid lines) and delayed-detonation (dashed lines for WDD2, C-DDT, and N100; dash-dotted lines for O-DDT). The Mn/Fe ratio is not shown here because it highly depends on the initial metallicity of SNIa progenitors (Sect. 3.2). Right: SNcc models, all taken from Nomoto et al. (2013), assuming a Salpeter IMF. Various initial metallicities (Zinit) for SNcc progenitors are compared. The dashed line corresponds to the Z0_cut model (see text).
Current usage metrics show cumulative count of Article Views (full-text article views including HTML views, PDF and ePub downloads, according to the available data) and Abstracts Views on Vision4Press platform.
Data correspond to usage on the plateform after 2015. The current usage metrics is available 48-96 hours after online publication and is updated daily on week days.
Initial download of the metrics may take a while.