Free Access
Fig. 6
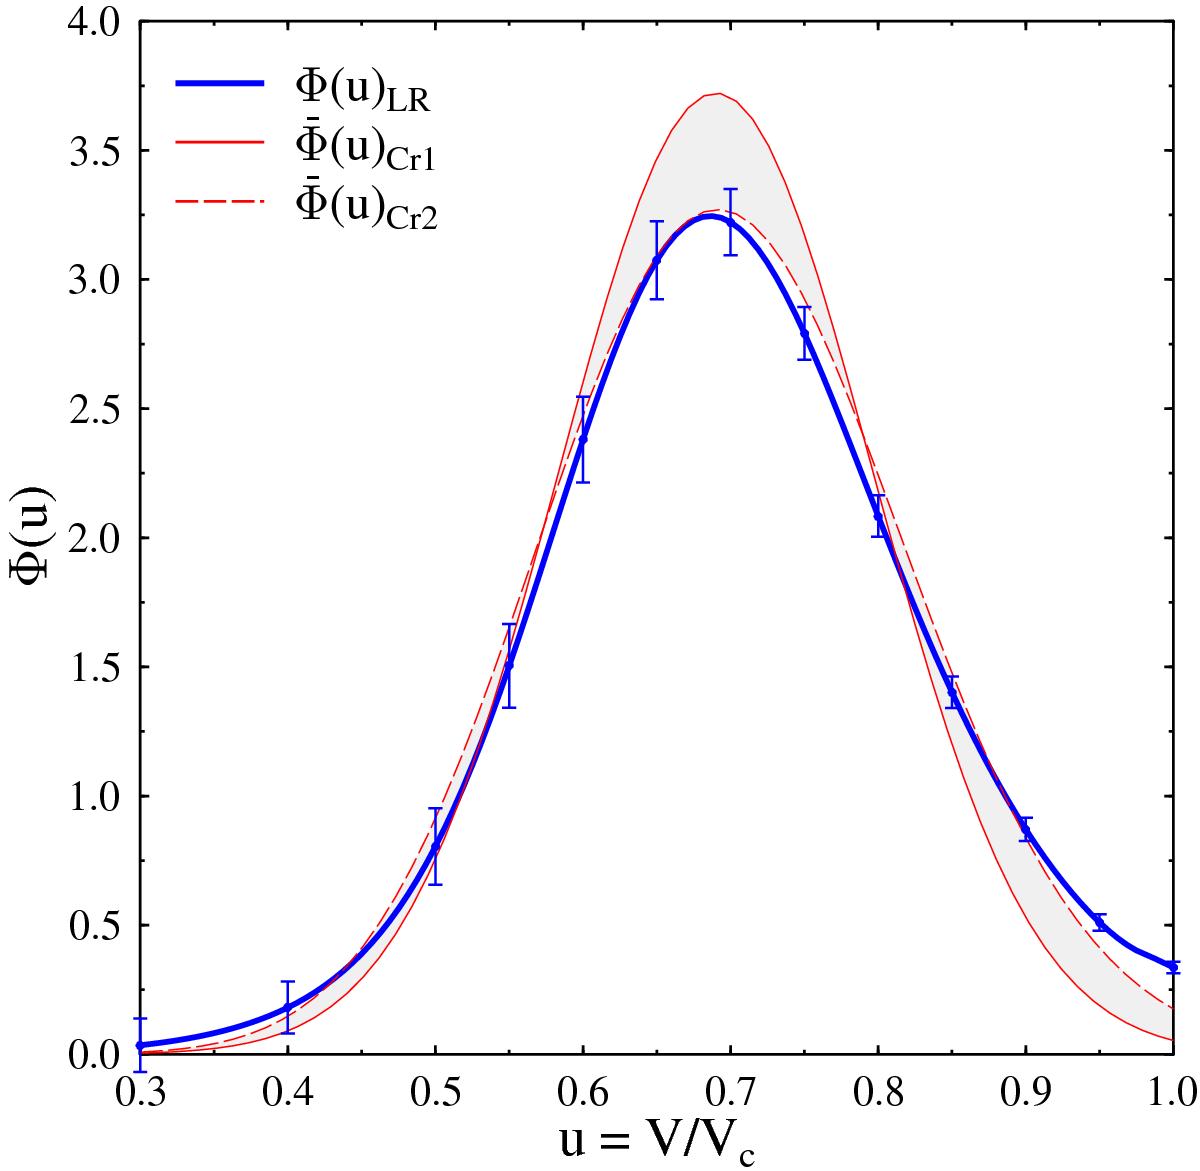
Distribution function Φ(u)LR obtained with the Lucy-Richardson method (blue curve) with the corresponding statistical uncertainties. Both distributions ![]() of true rotational velocities derived using the Cranmer method (red curves) are also superimposed.
of true rotational velocities derived using the Cranmer method (red curves) are also superimposed.
Current usage metrics show cumulative count of Article Views (full-text article views including HTML views, PDF and ePub downloads, according to the available data) and Abstracts Views on Vision4Press platform.
Data correspond to usage on the plateform after 2015. The current usage metrics is available 48-96 hours after online publication and is updated daily on week days.
Initial download of the metrics may take a while.