Free Access
Fig. 4
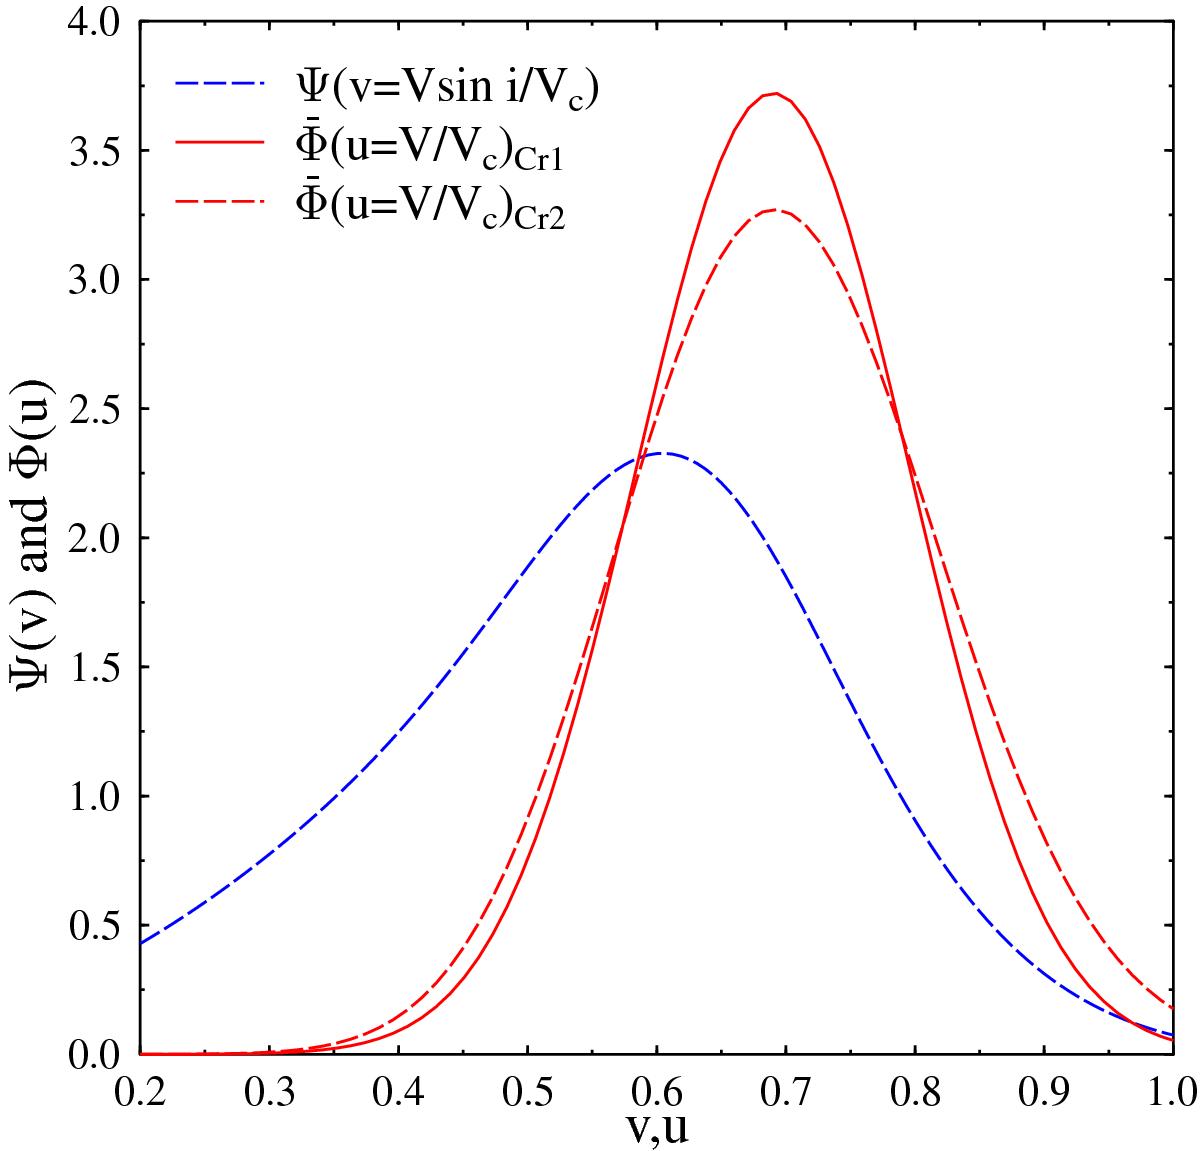
Diagram showing the two functions ![]() that lead to the same χ2;
that lead to the same χ2; ![]() (red full line) and
(red full line) and ![]() (red dashed line), obtained with the Cranmer method and the analytical form given in Eq. (12). The reference distribution Ψ(v) of ratios v = Vsini/Vc corrected for observational uncertainties is also shown (blue dashed curve).
(red dashed line), obtained with the Cranmer method and the analytical form given in Eq. (12). The reference distribution Ψ(v) of ratios v = Vsini/Vc corrected for observational uncertainties is also shown (blue dashed curve).
Current usage metrics show cumulative count of Article Views (full-text article views including HTML views, PDF and ePub downloads, according to the available data) and Abstracts Views on Vision4Press platform.
Data correspond to usage on the plateform after 2015. The current usage metrics is available 48-96 hours after online publication and is updated daily on week days.
Initial download of the metrics may take a while.