Free Access
Fig. F.1
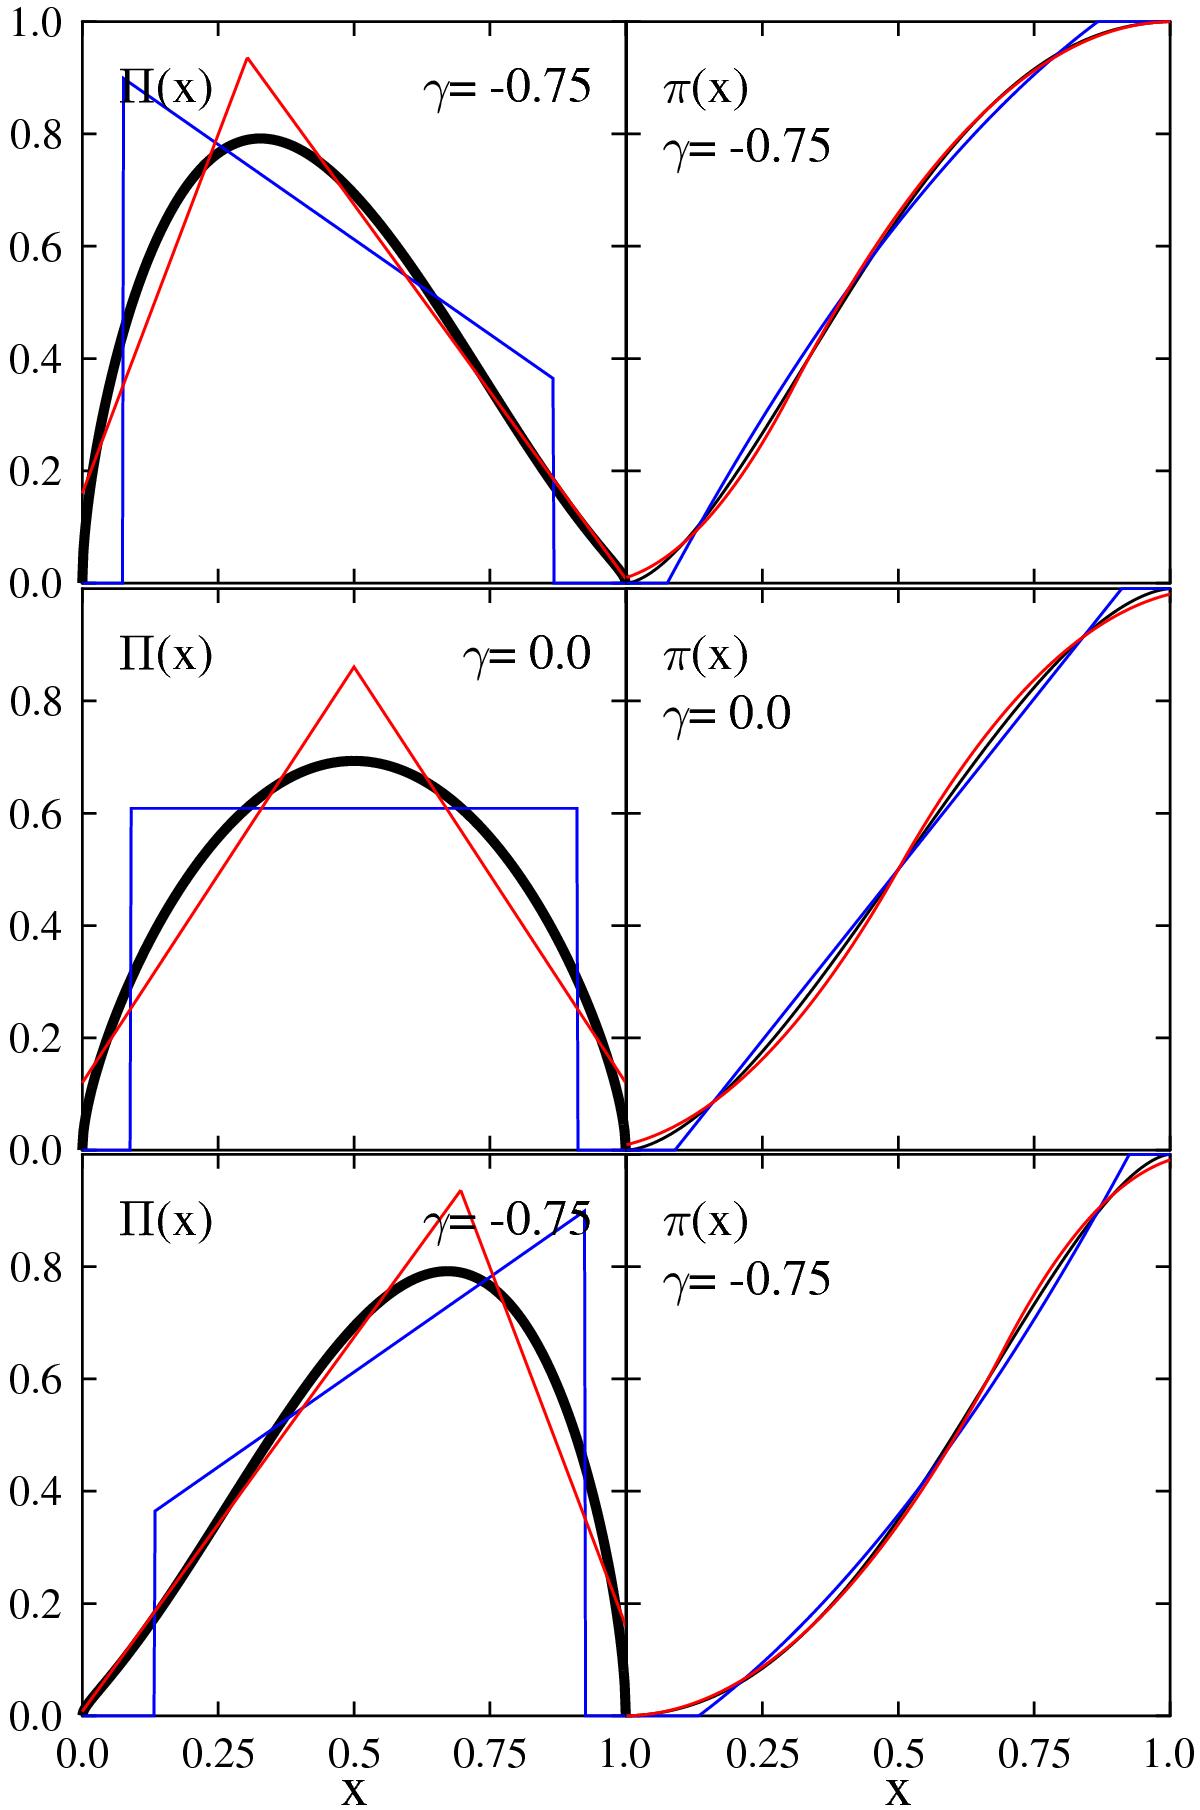
Left side: distribution functions Π(x) (thick black curves) and their quasi-equivalent trapezoidal (blue curves) and triangular (red curves) ![]() distributions up to the third moment. Right side: respective cumulative distributions
distributions up to the third moment. Right side: respective cumulative distributions ![]() .
.
Current usage metrics show cumulative count of Article Views (full-text article views including HTML views, PDF and ePub downloads, according to the available data) and Abstracts Views on Vision4Press platform.
Data correspond to usage on the plateform after 2015. The current usage metrics is available 48-96 hours after online publication and is updated daily on week days.
Initial download of the metrics may take a while.