Fig. 9
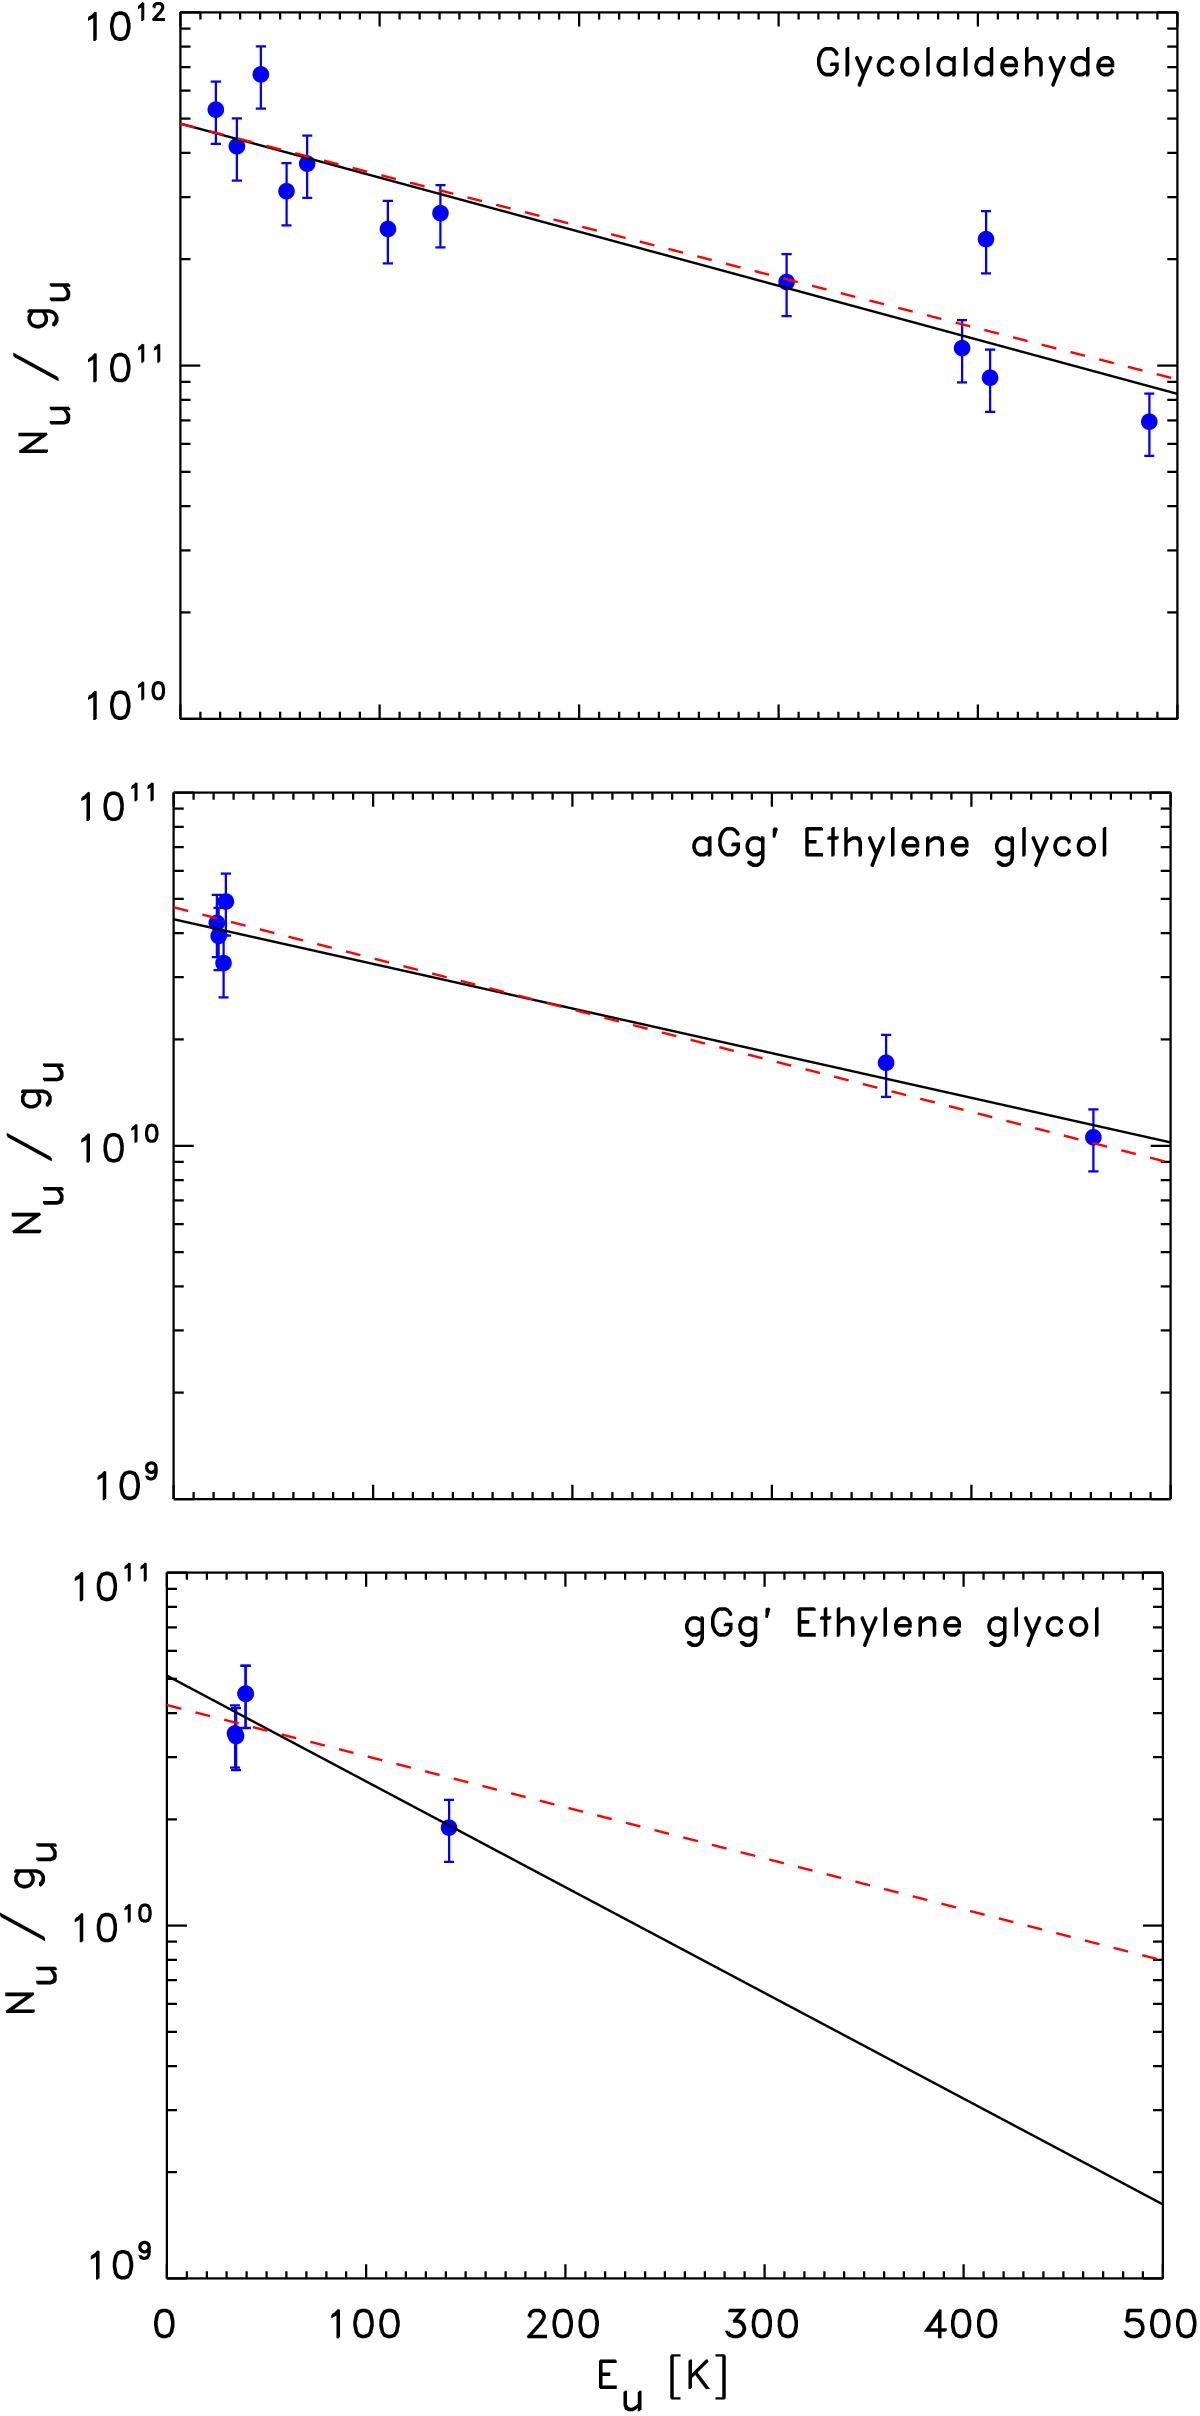
Rotation diagrams for glycolaldehyde and the two conformers (aGg′ and gGg′) of ethylene glycol based on the observations in Band 3. The solid line indicates the best fit line to the rotation diagram for each species and the dashed red line the best fit for a fixed temperature of 300 K. The error bars represent 1σ uncertainties.
Current usage metrics show cumulative count of Article Views (full-text article views including HTML views, PDF and ePub downloads, according to the available data) and Abstracts Views on Vision4Press platform.
Data correspond to usage on the plateform after 2015. The current usage metrics is available 48-96 hours after online publication and is updated daily on week days.
Initial download of the metrics may take a while.