Fig. 7
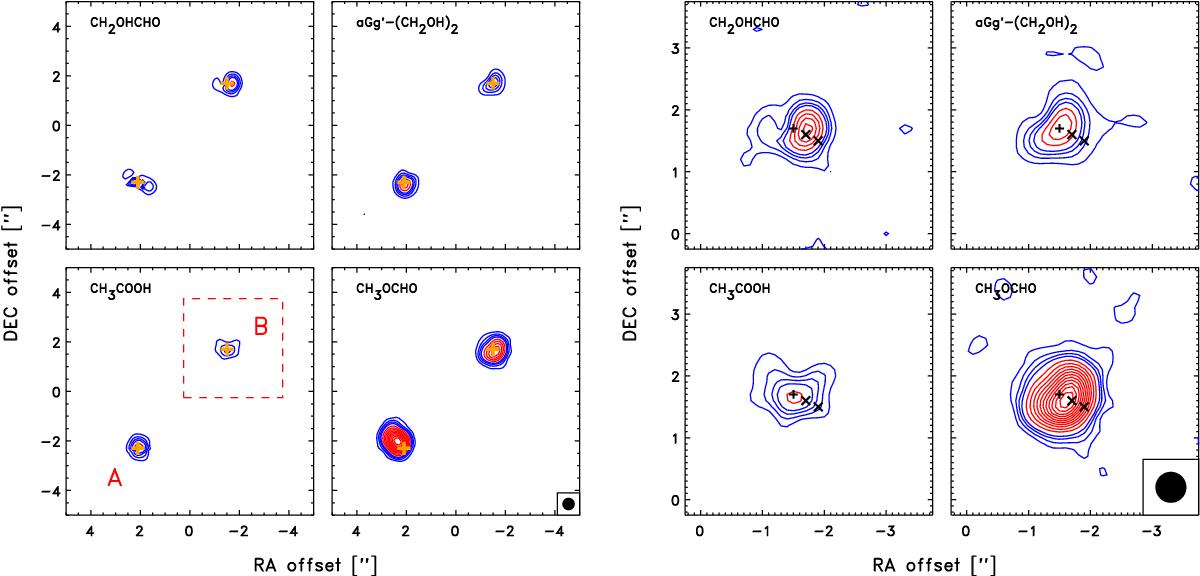
Maps of representative transitions of glycolaldehyde and related species. The four panels to the left show the entire IRAS 16293−2422 system, while the four panels to the right zoom-in on IRAS 16293B (indicated as the red dashed square in the lower left panel). The mapped species are glycolaldehyde (362.406 GHz, Eup = 266 K; upper left), ethylene glycol (348.550 GHz, Eup = 329 K; upper right), acetic acid (352.872 GHz, Eup = 275 K; lower left), and methyl formate (360.467 GHz, Eup=324 K; lower right). In each map the contours represent the integrated emission over ± 0.5 km s-1 in steps of 15 mJy km s-1 (approximately 3σ). In each panel the plus sign marks the location of the continuum sources associated with IRAS 16293A and IRAS 16293B (labeled A and B in the lower left panel), while the crosses in the right panels represent the positions offset by half a beam and a full beam from IRAS 16293B. These are the positions used for line identification/modeling.
Current usage metrics show cumulative count of Article Views (full-text article views including HTML views, PDF and ePub downloads, according to the available data) and Abstracts Views on Vision4Press platform.
Data correspond to usage on the plateform after 2015. The current usage metrics is available 48-96 hours after online publication and is updated daily on week days.
Initial download of the metrics may take a while.