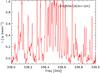
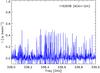
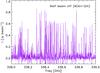
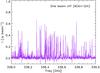
Fig. 6
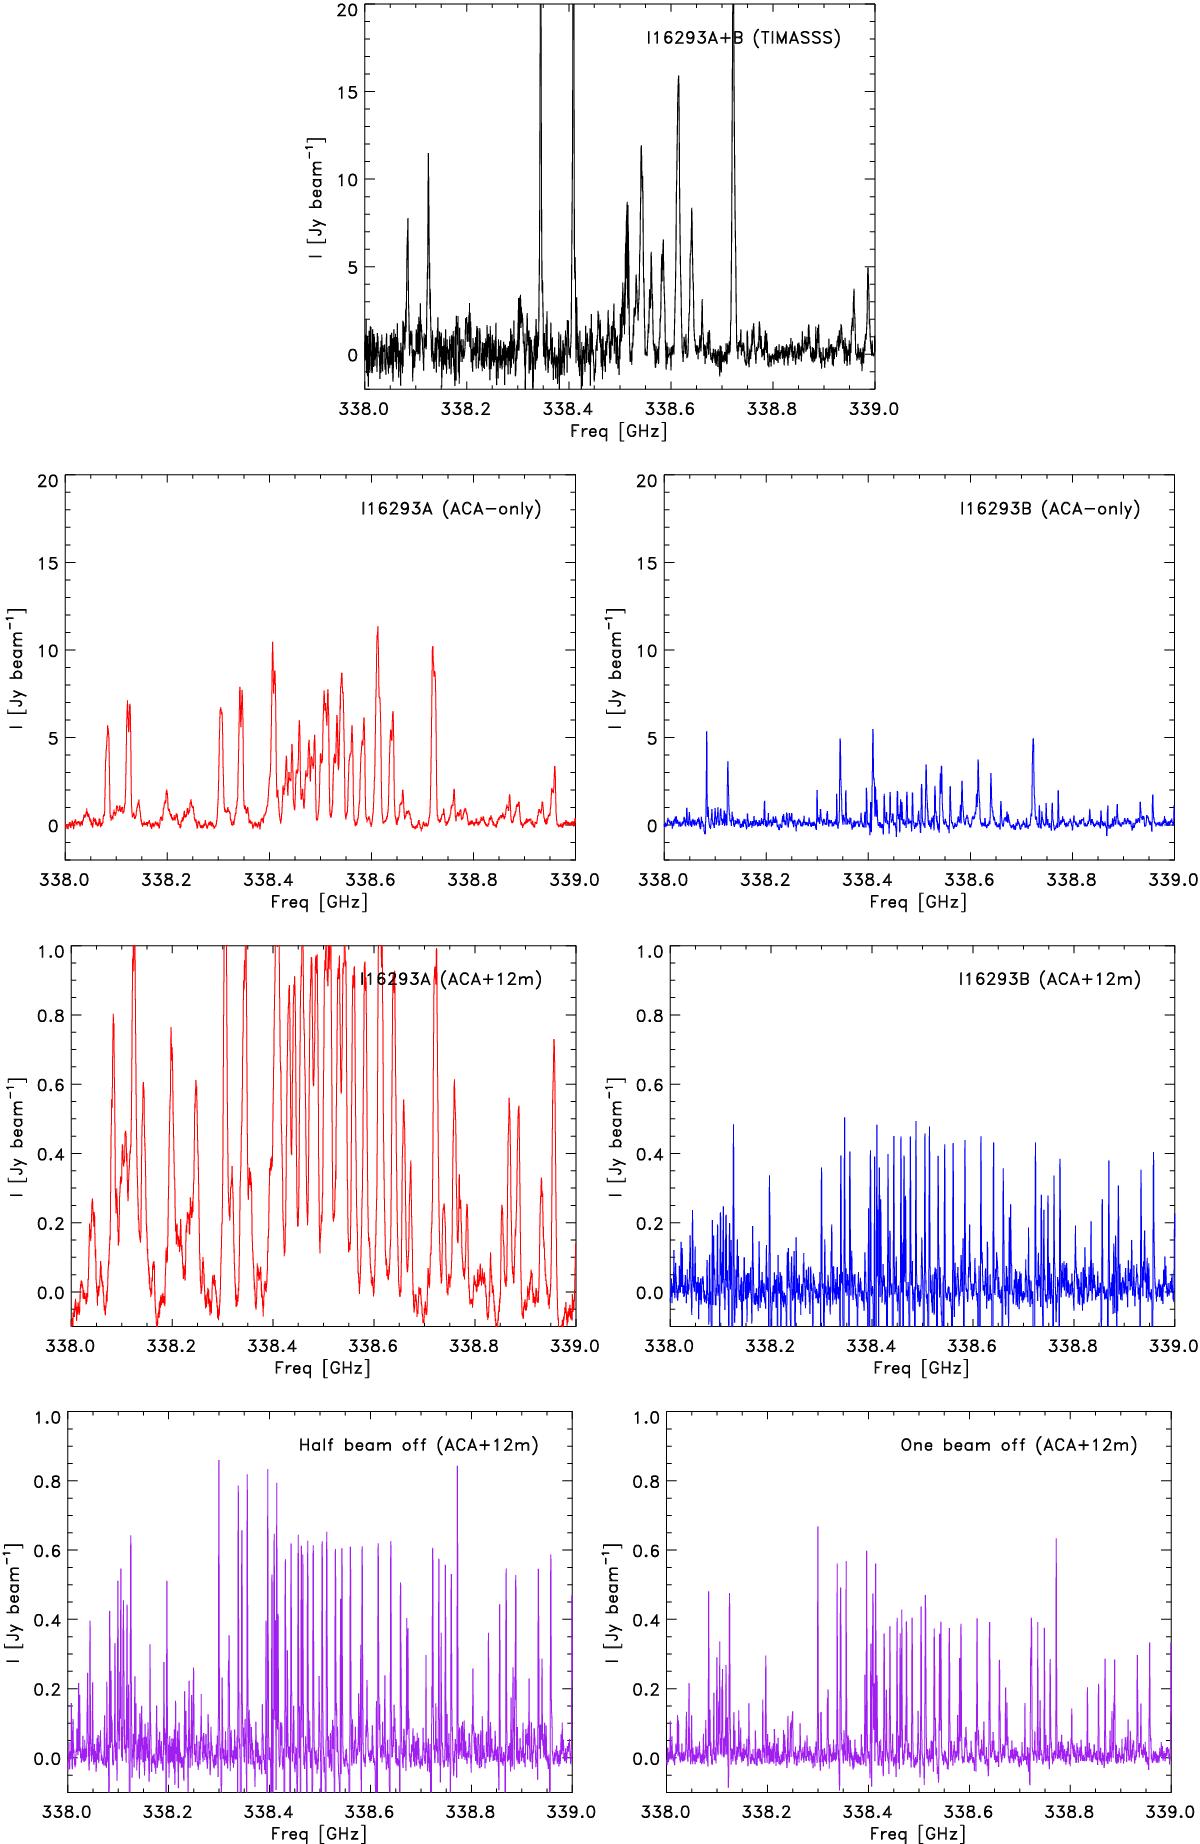
Comparison between the spectra in the 338 GHz window around the prominent CH3OH branch from the single-dish observations from the TIMASSS survey (Caux et al. 2011) (top row), the ACA-only data toward IRAS 16293A and IRAS 16293B (second row; left and right, respectively), the full data toward IRAS 16293A and IRAS 16293B (third row; left and right, respectively), and positions offset by a half and full beam southwest of the IRAS 16293B continuum position (bottom row). The scale on the Y-axis in the bottom two rows is different from the top rows.
Current usage metrics show cumulative count of Article Views (full-text article views including HTML views, PDF and ePub downloads, according to the available data) and Abstracts Views on Vision4Press platform.
Data correspond to usage on the plateform after 2015. The current usage metrics is available 48-96 hours after online publication and is updated daily on week days.
Initial download of the metrics may take a while.