Fig. 4
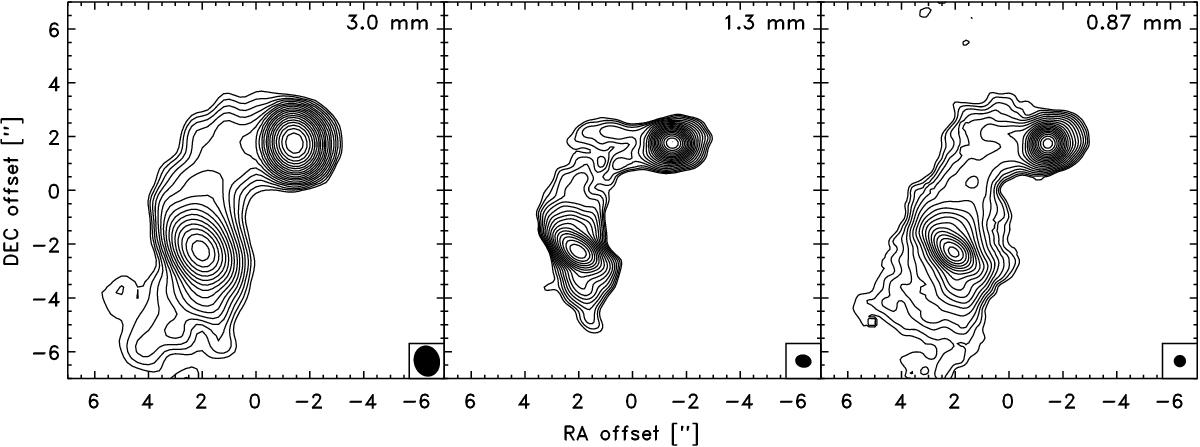
Continuum images at 3.0, 1.3, and 0.87 mm (left, middle, and right) at the angular resolution of each dataaset. The 0.87 mm images include both 12 m array and ACA data, while the 3.0 and 1.3 mm images only contain data from the 12 mm array. The contour levels are given as 20 logarithmically divided levels between 0.5% and 100% of the peak flux at the given wavelength. The RA and Dec offsets are relative to the phase center for the observations.
Current usage metrics show cumulative count of Article Views (full-text article views including HTML views, PDF and ePub downloads, according to the available data) and Abstracts Views on Vision4Press platform.
Data correspond to usage on the plateform after 2015. The current usage metrics is available 48-96 hours after online publication and is updated daily on week days.
Initial download of the metrics may take a while.