Free Access
Fig. C.1
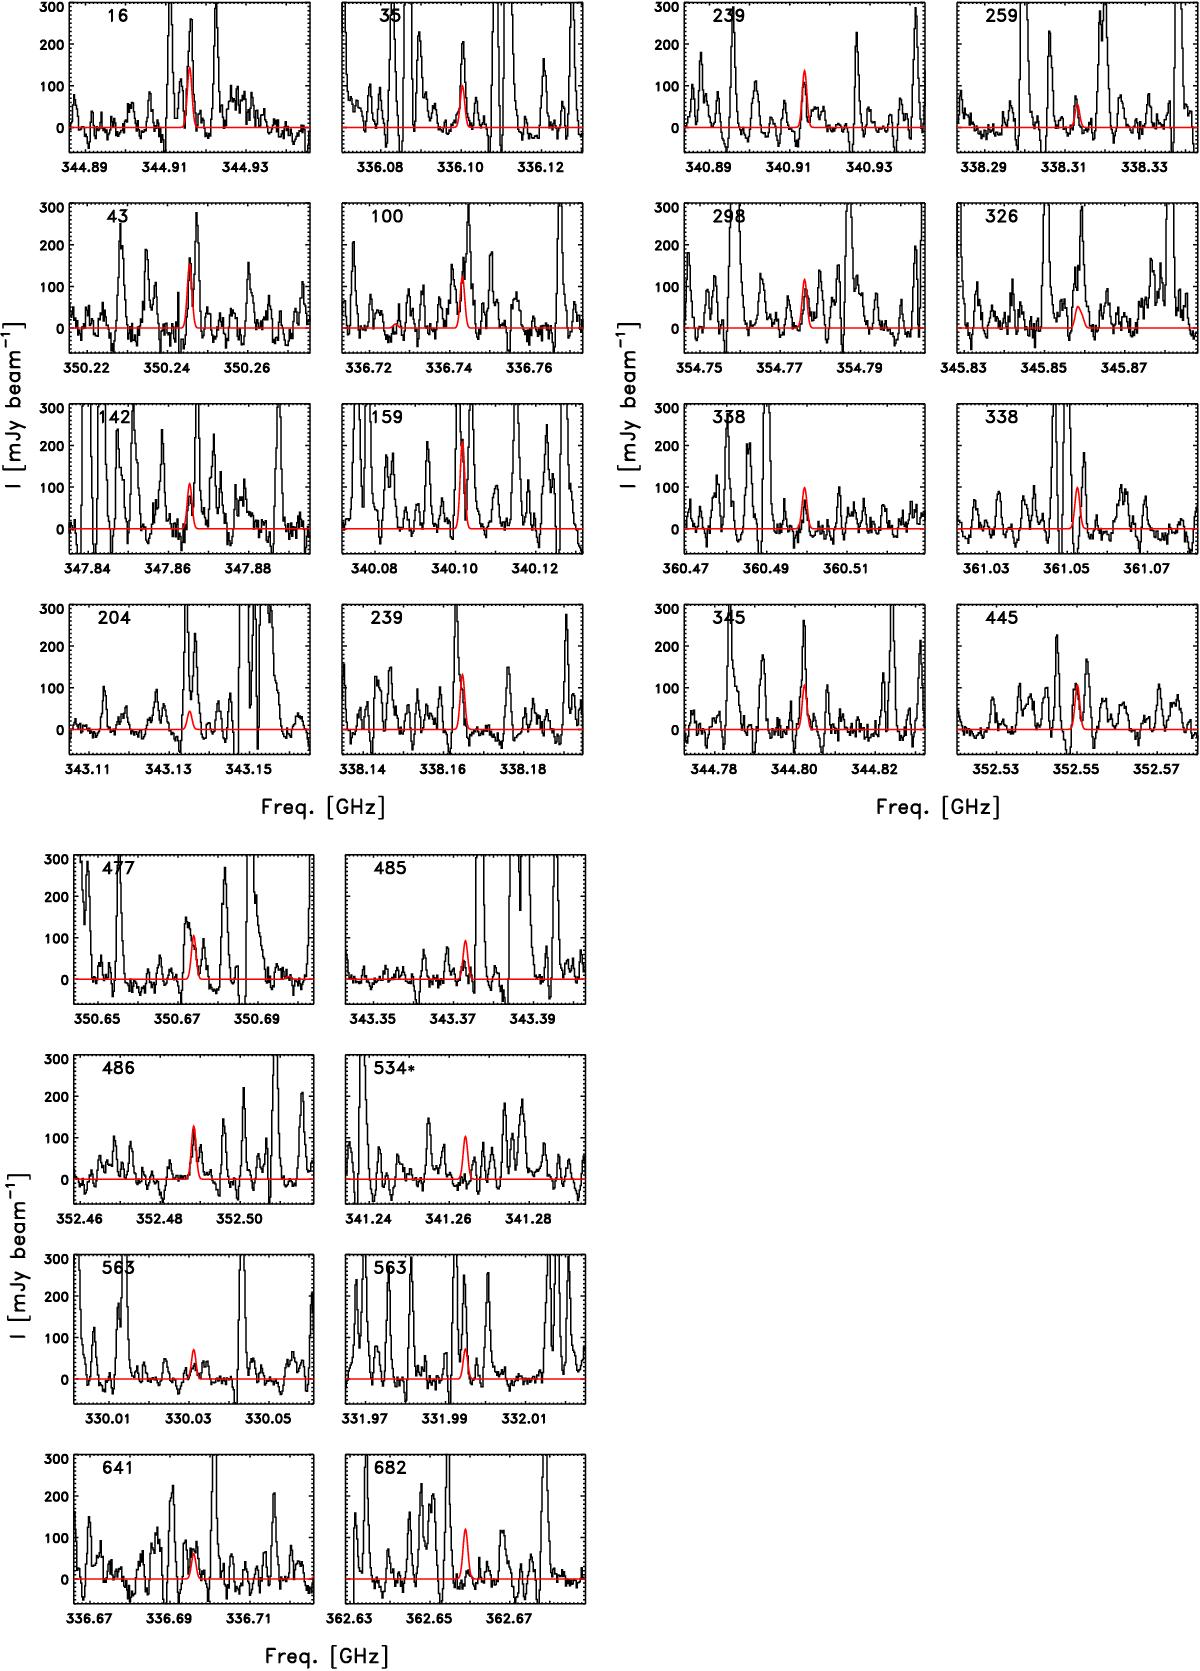
The 24 brightest lines of CH![]() OH as expected from the synthetic spectrum. These lines are sorted according to Eup given in K in the upper left corner of each panel. For frequencies where multiple transitions are overlapping an asterisk (∗) is added after the value of Eup.
OH as expected from the synthetic spectrum. These lines are sorted according to Eup given in K in the upper left corner of each panel. For frequencies where multiple transitions are overlapping an asterisk (∗) is added after the value of Eup.
This figure is made of several images, please see below:
Current usage metrics show cumulative count of Article Views (full-text article views including HTML views, PDF and ePub downloads, according to the available data) and Abstracts Views on Vision4Press platform.
Data correspond to usage on the plateform after 2015. The current usage metrics is available 48-96 hours after online publication and is updated daily on week days.
Initial download of the metrics may take a while.