Fig. 2
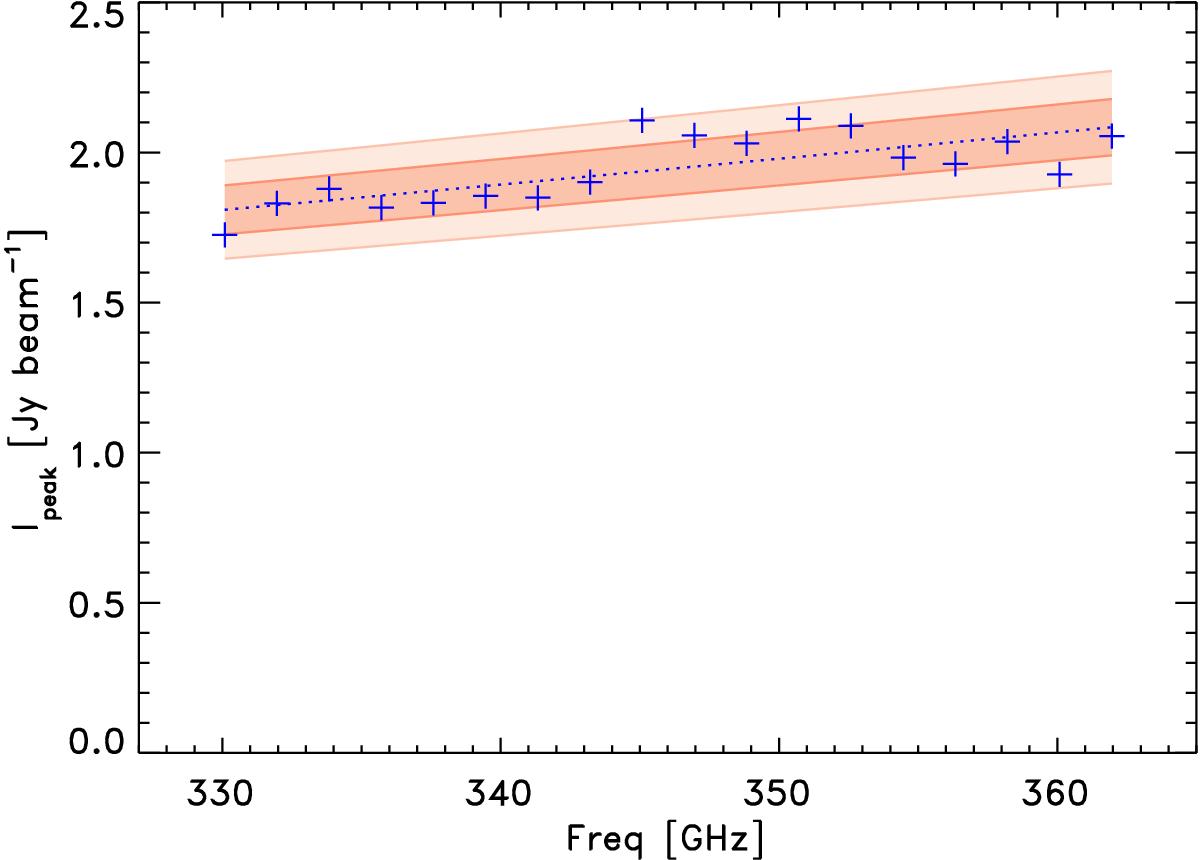
Continuum peak flux (in a 0.5′′ beam toward IRAS 16293B for the 18 different spectral setups (plus signs) as a function of frequency. A slight increase in flux as a function of frequency is seen that can be approximated by a power-law Fν ∝ ν2. The shaded areas correspond to this dependency ± 5% (darker color) and ± 10% (lighter color). About 70% of the measurements are within the ± 5% region with all of the measurements within the ± 10% area.
Current usage metrics show cumulative count of Article Views (full-text article views including HTML views, PDF and ePub downloads, according to the available data) and Abstracts Views on Vision4Press platform.
Data correspond to usage on the plateform after 2015. The current usage metrics is available 48-96 hours after online publication and is updated daily on week days.
Initial download of the metrics may take a while.