Free Access
Fig. 1

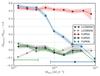
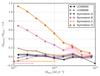
Ratio of kinetic and lensing mass for the analyzed f(R) models (left panel) and Symmetron models (right panel). The horizontal lines and markers show the width and center of the transition region as defined in Sect. 2.4, respectively.
This figure is made of several images, please see below:
Current usage metrics show cumulative count of Article Views (full-text article views including HTML views, PDF and ePub downloads, according to the available data) and Abstracts Views on Vision4Press platform.
Data correspond to usage on the plateform after 2015. The current usage metrics is available 48-96 hours after online publication and is updated daily on week days.
Initial download of the metrics may take a while.