Fig. 8
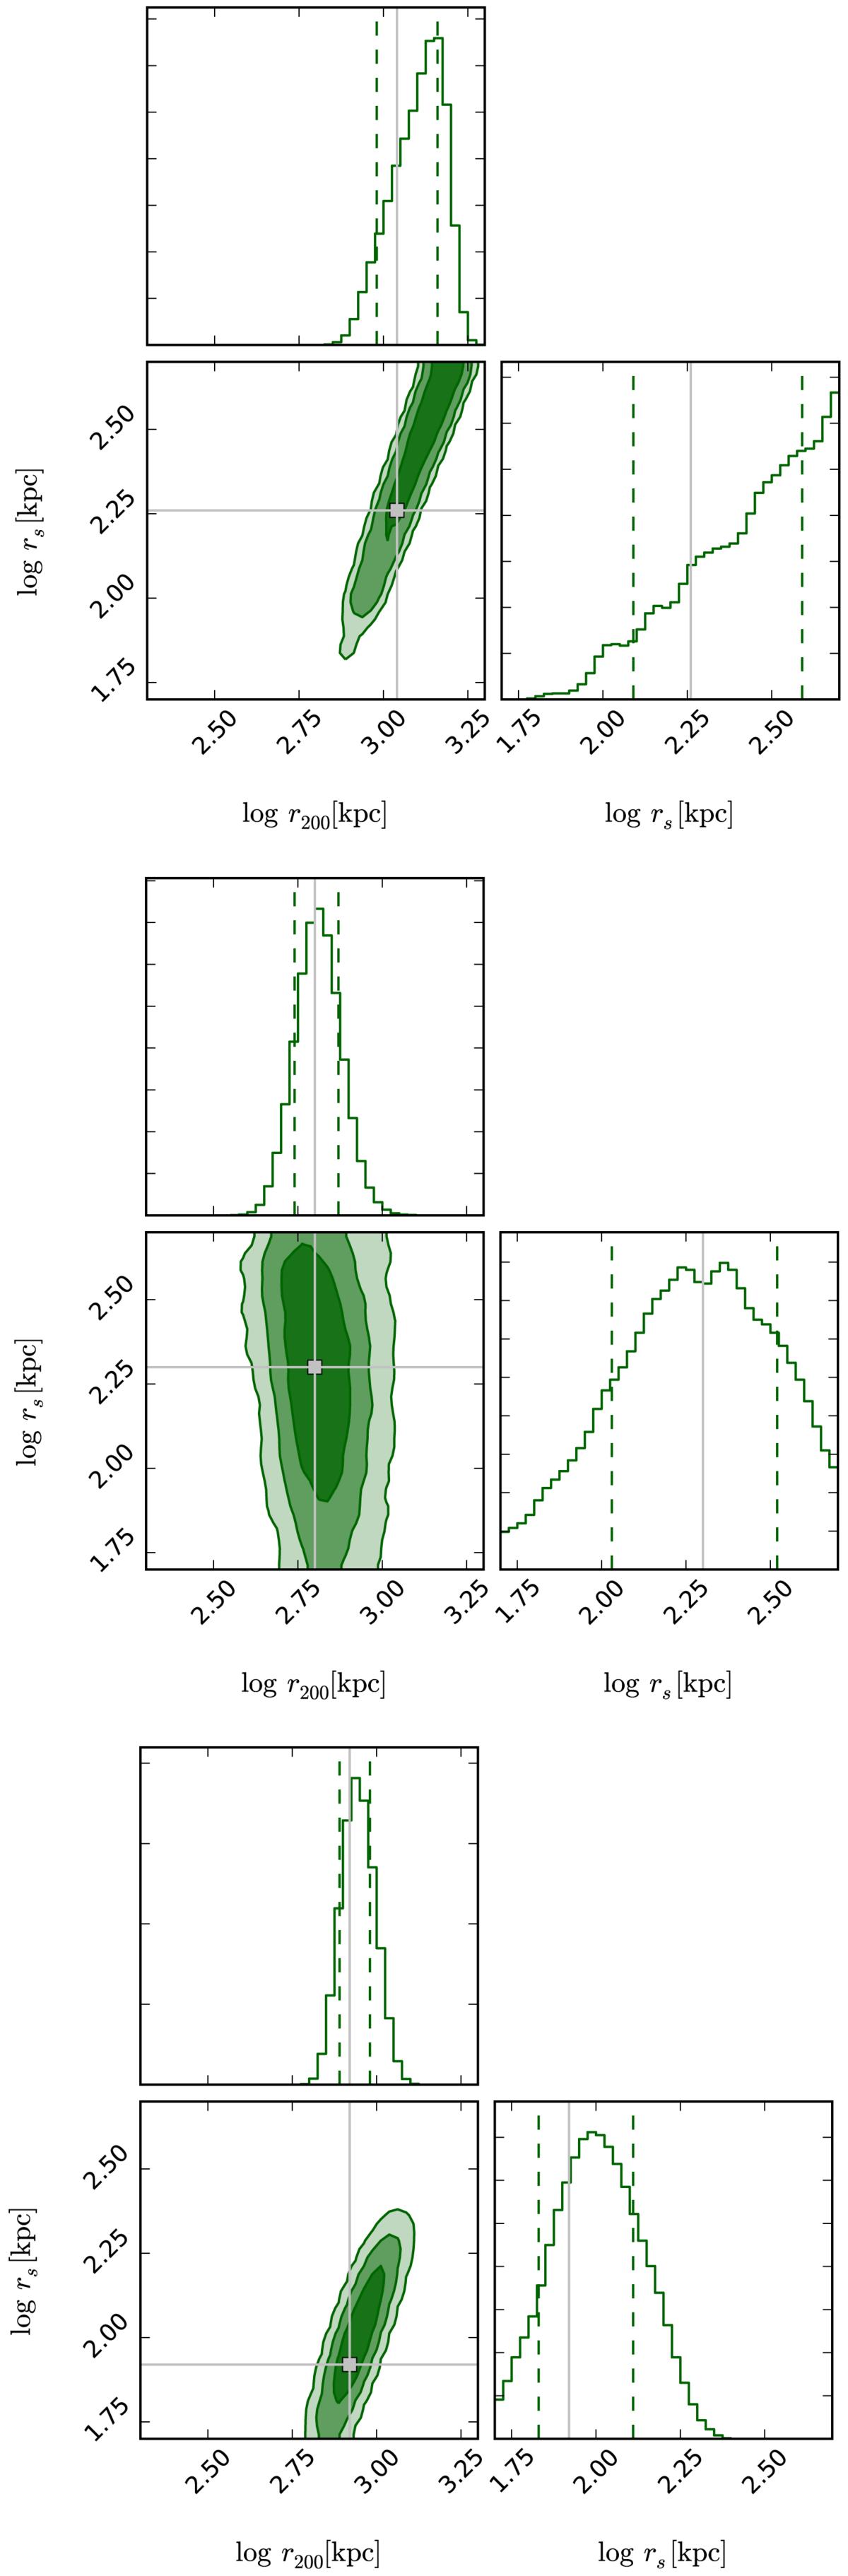
PDFs and contours of the parameters logrs and logr200. The three contours stand for the 68%, 95%, and 99% confidence levels. The values obtained for our best-fit model are indicated with a gray square and with vertical lines in the 1D histograms; the asymmetric errors are presented in Table 1. Top panel: results from the SL model. Middle panel: results from the Dyn model.Bottom panel: results from the SL+Dyn model.
Current usage metrics show cumulative count of Article Views (full-text article views including HTML views, PDF and ePub downloads, according to the available data) and Abstracts Views on Vision4Press platform.
Data correspond to usage on the plateform after 2015. The current usage metrics is available 48-96 hours after online publication and is updated daily on week days.
Initial download of the metrics may take a while.