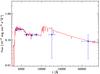
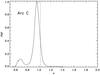
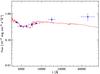
Fig. 5
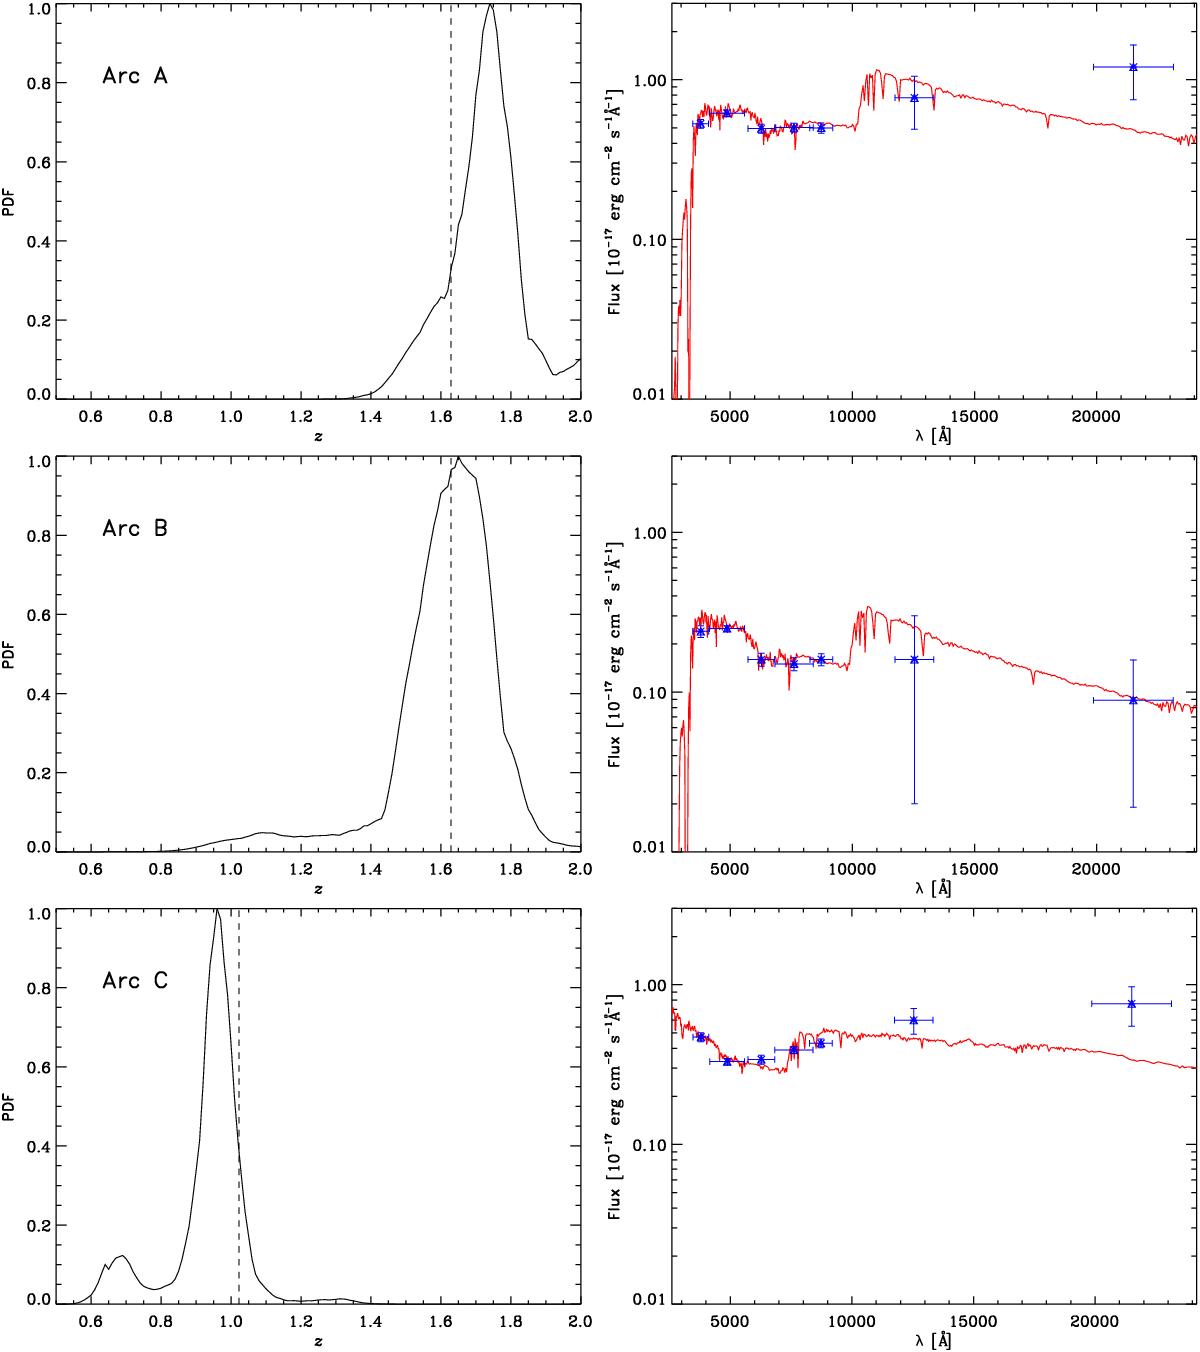
Left column: photometric redshift PDF for the selected arcs (see text). The dashed vertical lines correspond to the spectroscopic value. Right column: best-fit spectral energy distribution. Points represent the observed CFHTLS broadband magnitudes, and J and Ks from WIRCam. Vertical and horizontal error bars correspond to photometric error and wavelength range of each filter, respectively.
Current usage metrics show cumulative count of Article Views (full-text article views including HTML views, PDF and ePub downloads, according to the available data) and Abstracts Views on Vision4Press platform.
Data correspond to usage on the plateform after 2015. The current usage metrics is available 48-96 hours after online publication and is updated daily on week days.
Initial download of the metrics may take a while.