Fig. 4
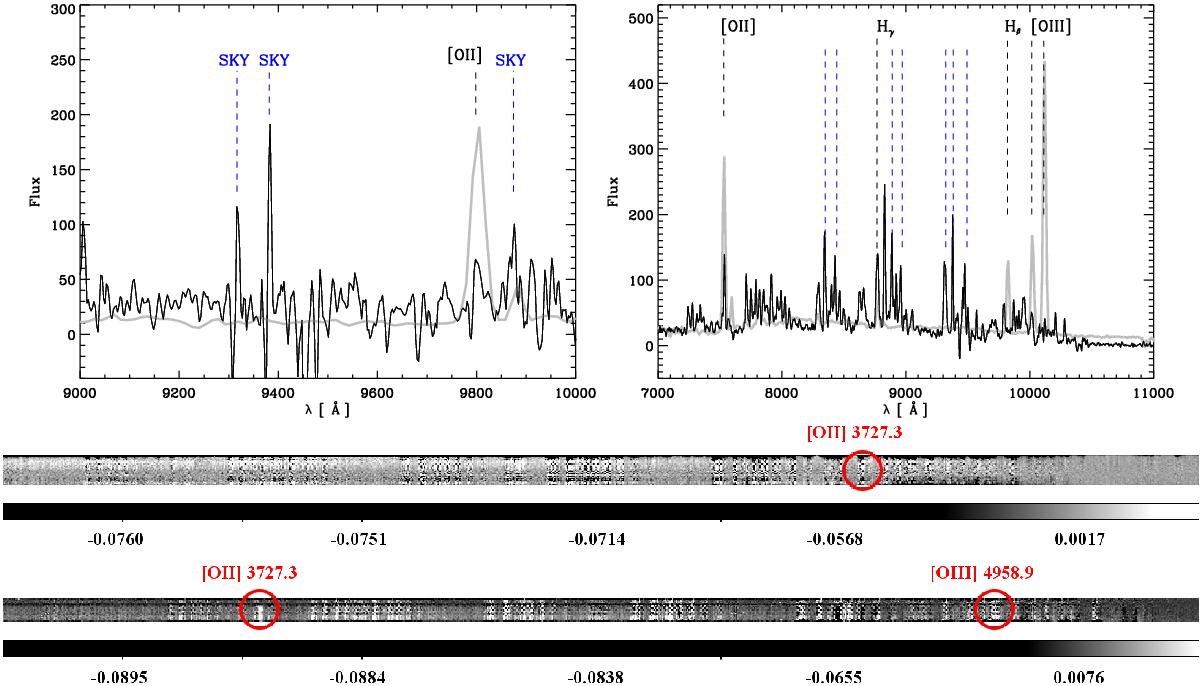
Top panel: as mentioned in Sect. 3.3, the slit length was limited by the position of the arcs, hence producing poor sky subtraction. Left: observed spectrum of arc A (black continuous line). In gray we depict a starburst template from Kinney et al. (1996) shifted at z = 1.628, and we indicate a possible [OII]λ3727 emission line, and some sky lines, in blue (see Sect. 3.3). Right: observed spectrum of arc C (black continuous line), as before we depicted in gray the starburst template from Kinney et al. (1996), but shifted at z = 1.02. We indicated some characteristic emission lines, along with the sky lines in blue, but we omit for clarity the labels of the last lines. Bottom panel: two-dimensional spectra of arc A (with a color bar in arbitrary units). We note the [OII]λ3727 emission line. Below, we show the two-dimensional spectra of arc C, with two emission lines clearly identified: [OII]λ3727, and [OIII]λ4958.9.
Current usage metrics show cumulative count of Article Views (full-text article views including HTML views, PDF and ePub downloads, according to the available data) and Abstracts Views on Vision4Press platform.
Data correspond to usage on the plateform after 2015. The current usage metrics is available 48-96 hours after online publication and is updated daily on week days.
Initial download of the metrics may take a while.