Fig. 12
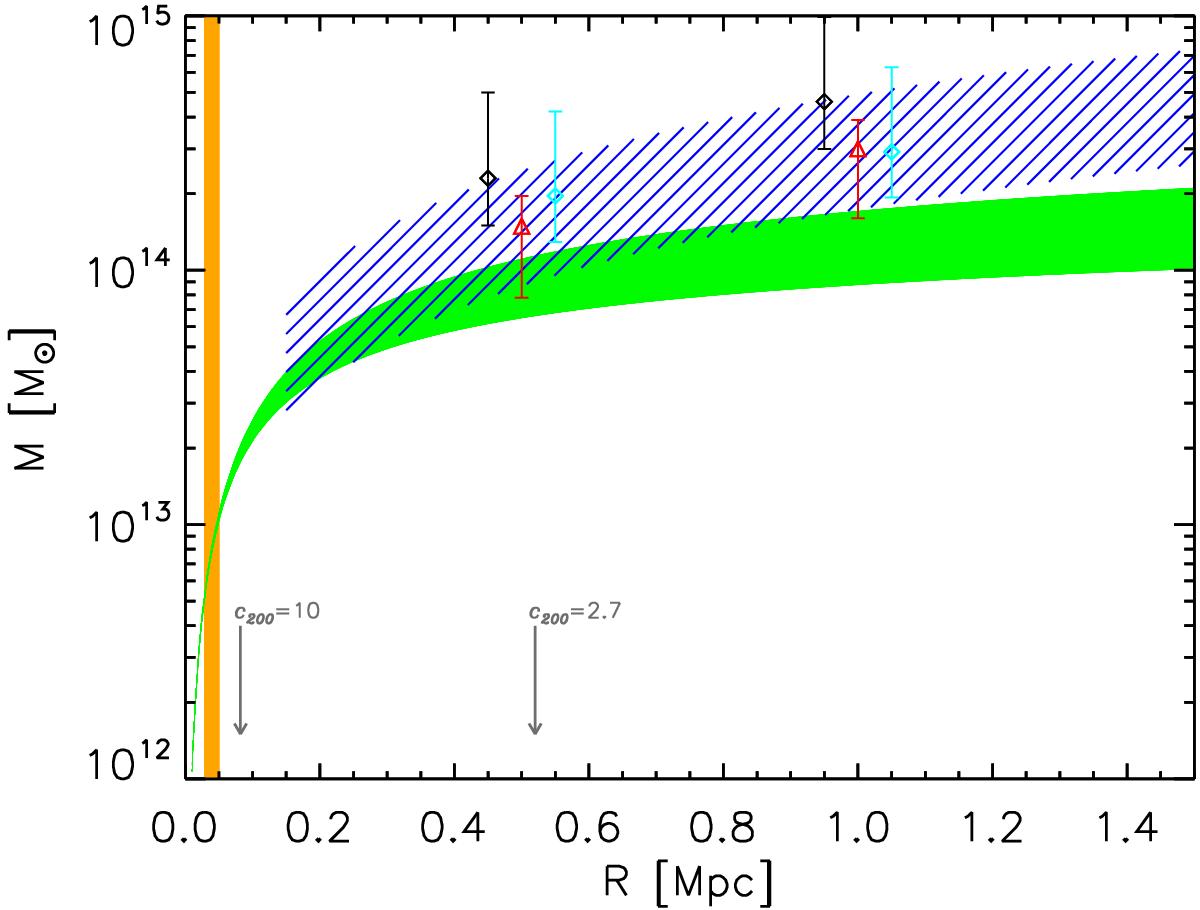
Two-dimensional projected mass as a function of the radius measured from the BGG. The green and blue shaded areas corresponds to the mass profile within 1σ errors for the SL+Dyn model and the weak lensing model reported in VMM11, respectively. The orange-shaded region shows the area where the arc systems lie. The two red triangles with error bars show two estimates (at 0.5 and 1 Mpc) of the weak lensing mass from Foëx et al. (2013). Black diamonds (shifted in r-0.05 for clarity) show the predicted mass calculated from the work of Lieu et al. (2016). Cyan diamonds (shifted in r+0.05 for clarity) are the masses calculated from Lieu et al. (2016) data, but assuming c200 = 10 (see text). We also depict with two arrows, our best rs (for c200 = 10), and the rs (for c200 = 2.7) reported in Lieu et al. (2016).
Current usage metrics show cumulative count of Article Views (full-text article views including HTML views, PDF and ePub downloads, according to the available data) and Abstracts Views on Vision4Press platform.
Data correspond to usage on the plateform after 2015. The current usage metrics is available 48-96 hours after online publication and is updated daily on week days.
Initial download of the metrics may take a while.