Fig. 10
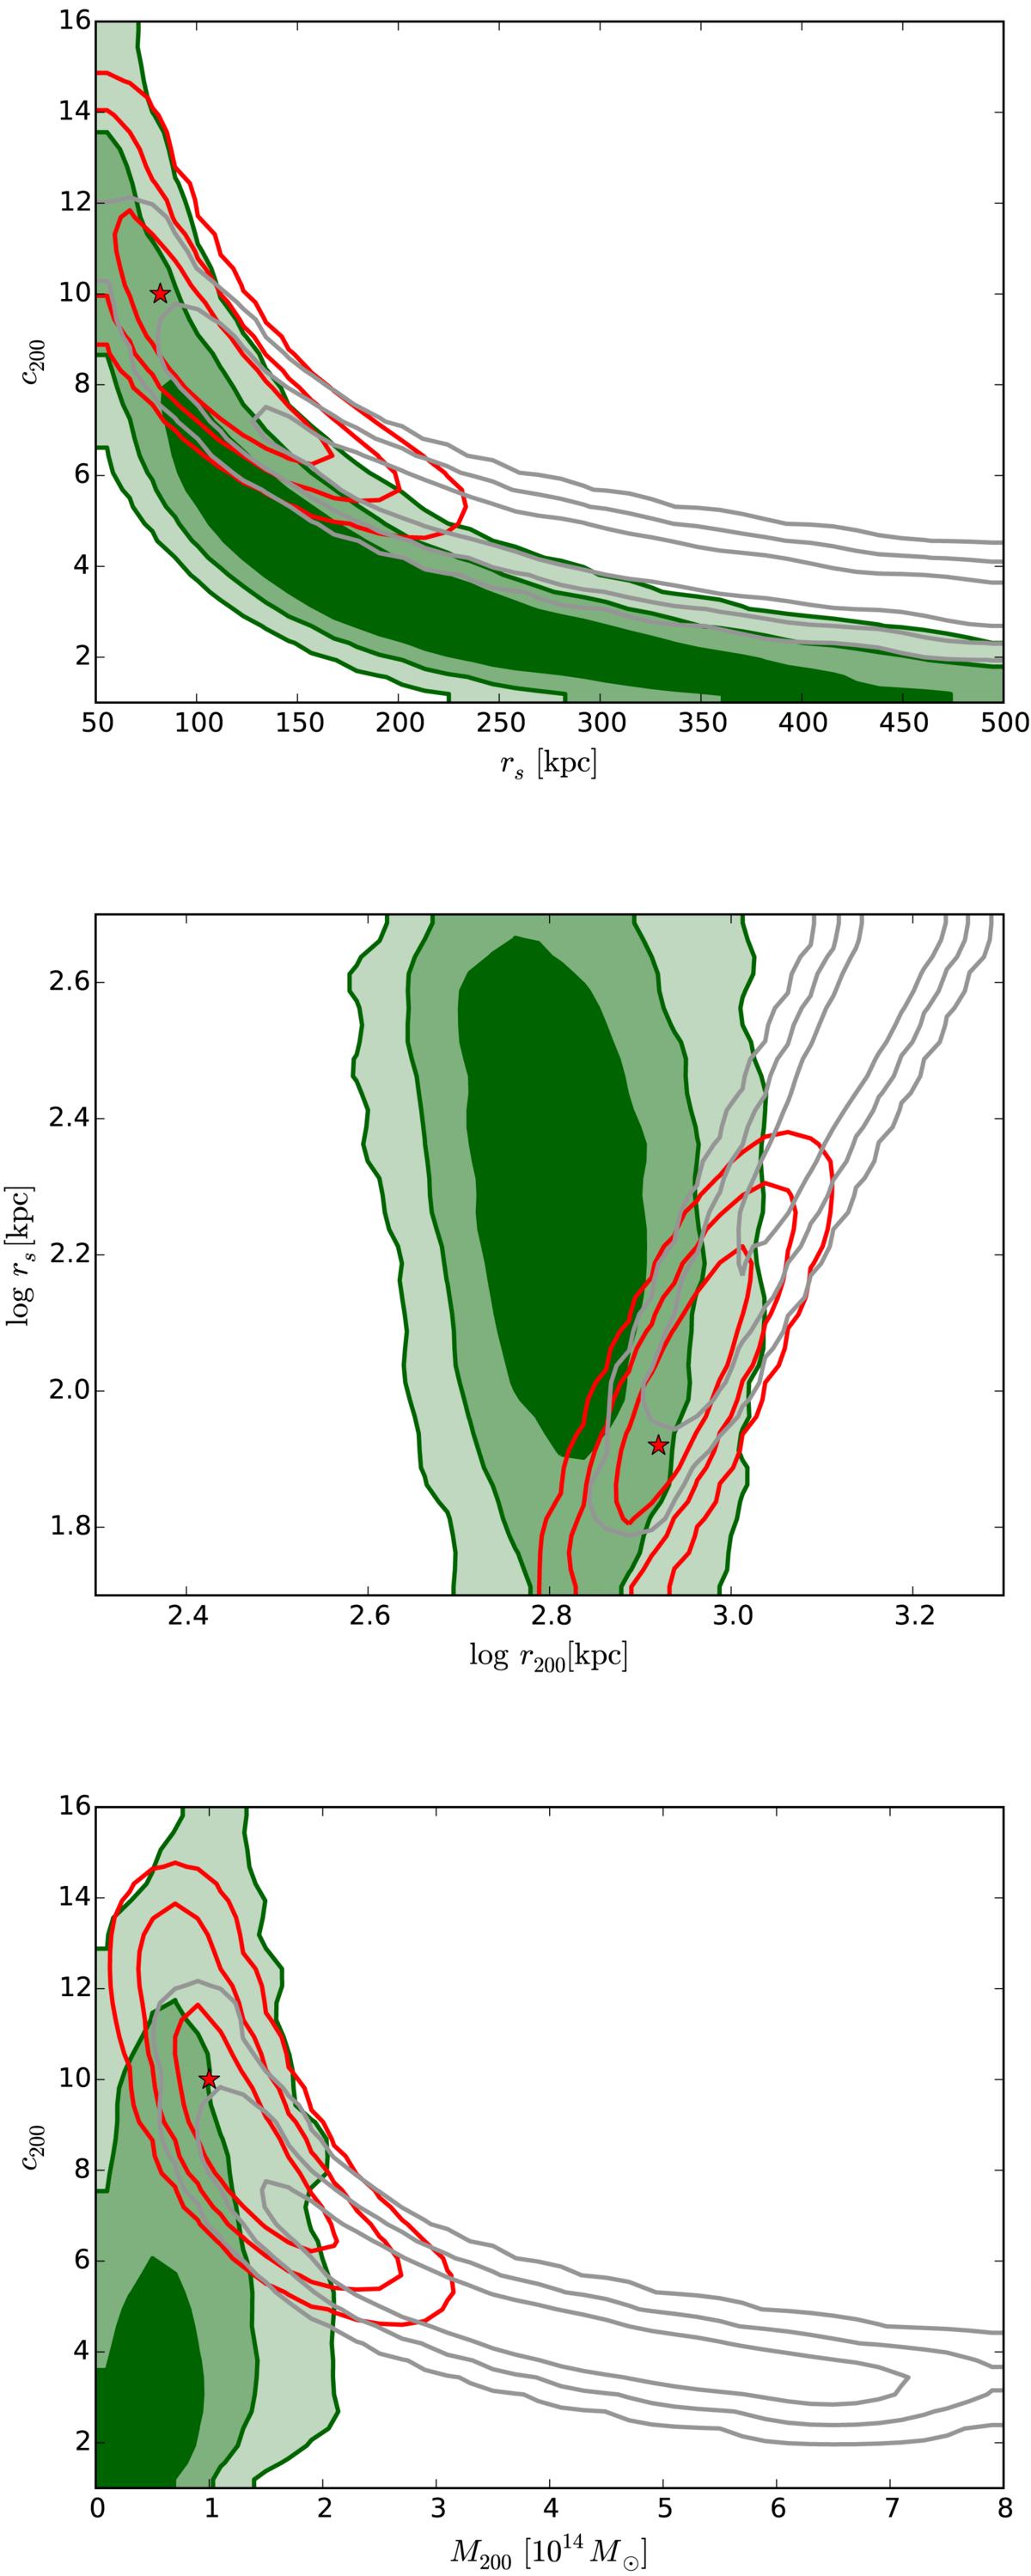
Joint distributions. Top panel: scale radius and concentration. Middle panel: log rs and log r200. Bottom panel: concentration and M200. Green-filled contours are 1, 2, and 3σ regions from the Dyn model. Gray contours stand for the 68, 95, and 99% confidence levels for the SL model. Red contours is the result of the SL+Dyn model with the best solution depicted with a red star.
Current usage metrics show cumulative count of Article Views (full-text article views including HTML views, PDF and ePub downloads, according to the available data) and Abstracts Views on Vision4Press platform.
Data correspond to usage on the plateform after 2015. The current usage metrics is available 48-96 hours after online publication and is updated daily on week days.
Initial download of the metrics may take a while.