Fig. 3
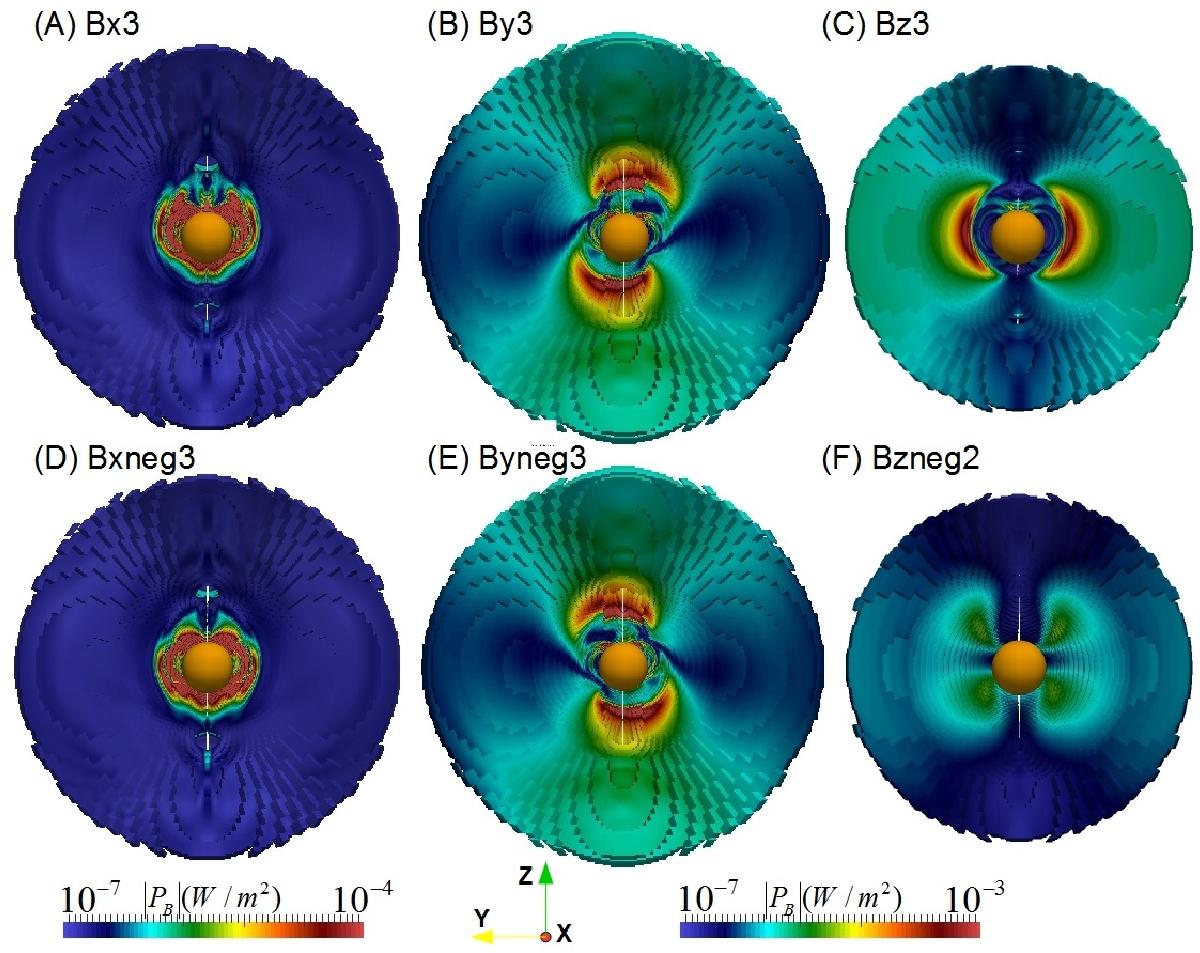
Frontal view of the magnetic energy flux on the planet day side for different IMF orientations. We observe the magnetic energy flux distribution towards the planet-Sun direction from the night side. 1st color bar is related to A) and D) panels, 2nd color bar to the other 4 cases. The plotted surface is defined between the bow shock and the magnetopause where the magnetic energy flux reaches its maxima (see Fig. 2, panels B and D, pink dashed line).
Current usage metrics show cumulative count of Article Views (full-text article views including HTML views, PDF and ePub downloads, according to the available data) and Abstracts Views on Vision4Press platform.
Data correspond to usage on the plateform after 2015. The current usage metrics is available 48-96 hours after online publication and is updated daily on week days.
Initial download of the metrics may take a while.