Fig. 2
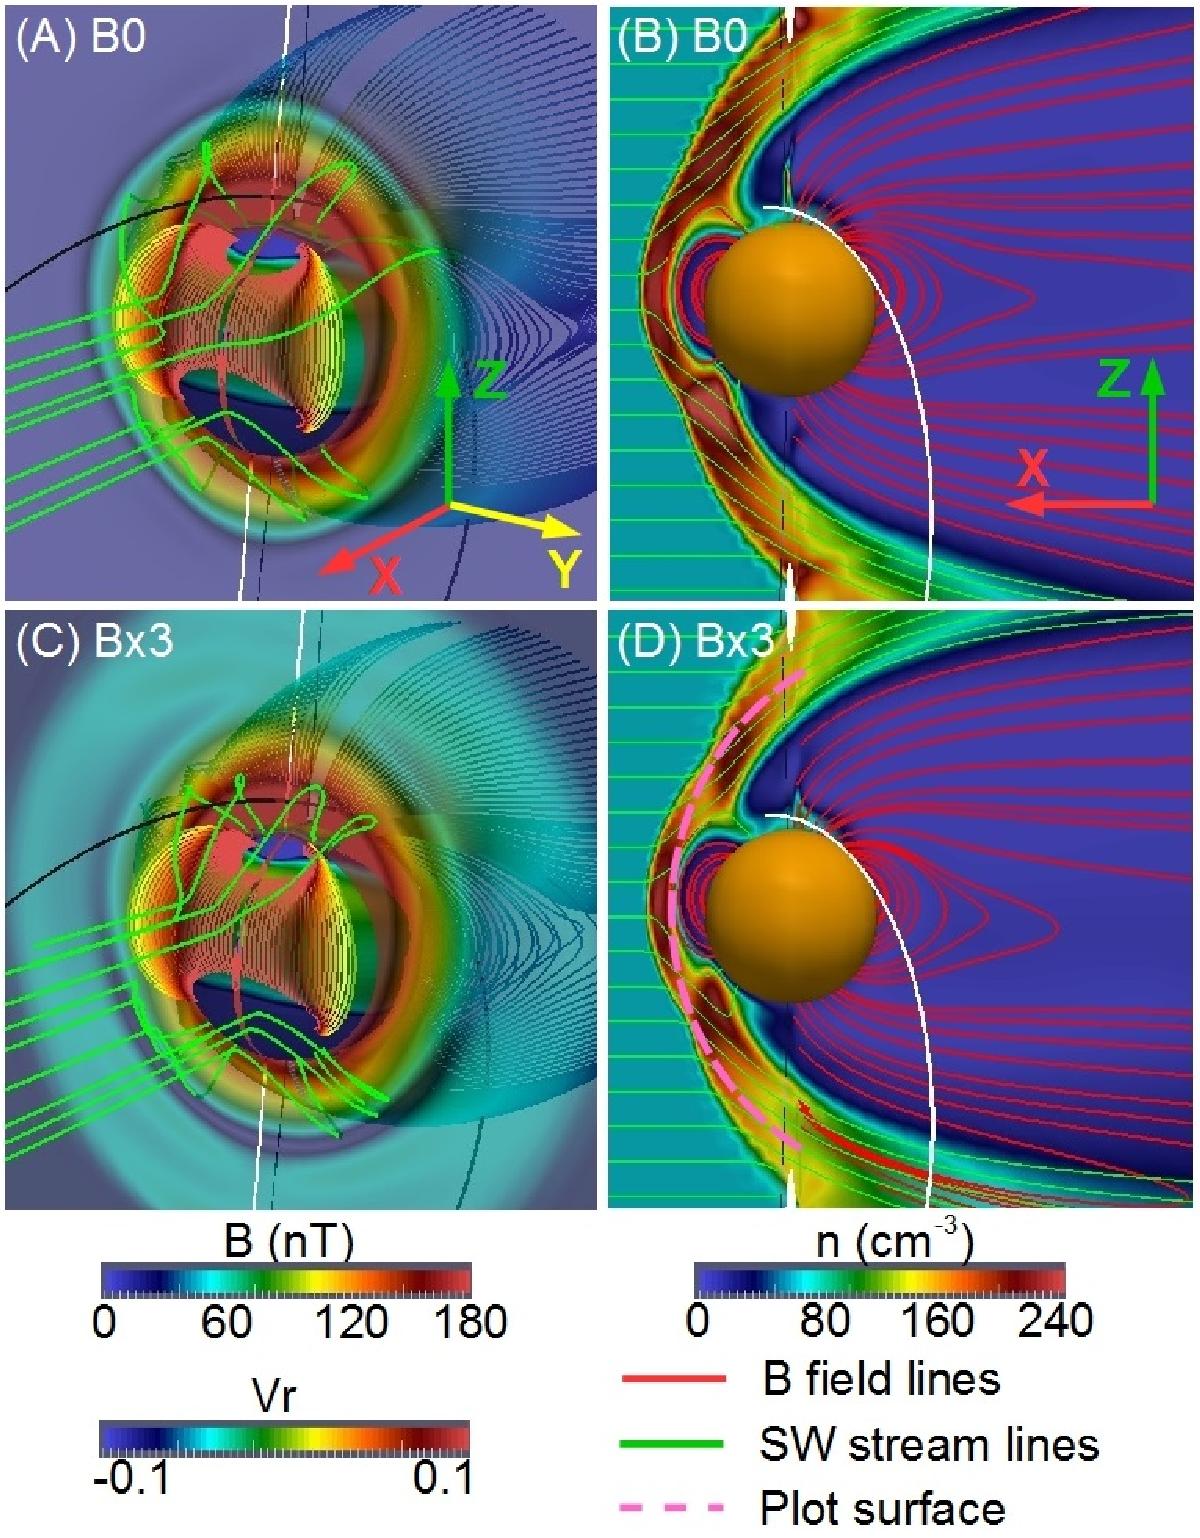
Hermean magnetic field lines with the intensity imprinted on the field lines by a color scale for the reference case A) and simulation Bx3 C). Magnetic field intensity at the frontal plane X = 0.3RM. SW stream lines (green). Inflow/outflow regions on the planet surface (blue/red). Polar plot of the density distribution (displaced 0.1RM in Y direction) for the reference case B) and simulation Bx3 D). Dashed pink curve indicates the surface plotted in Figs. 3 and 4.
Current usage metrics show cumulative count of Article Views (full-text article views including HTML views, PDF and ePub downloads, according to the available data) and Abstracts Views on Vision4Press platform.
Data correspond to usage on the plateform after 2015. The current usage metrics is available 48-96 hours after online publication and is updated daily on week days.
Initial download of the metrics may take a while.