Fig. 1
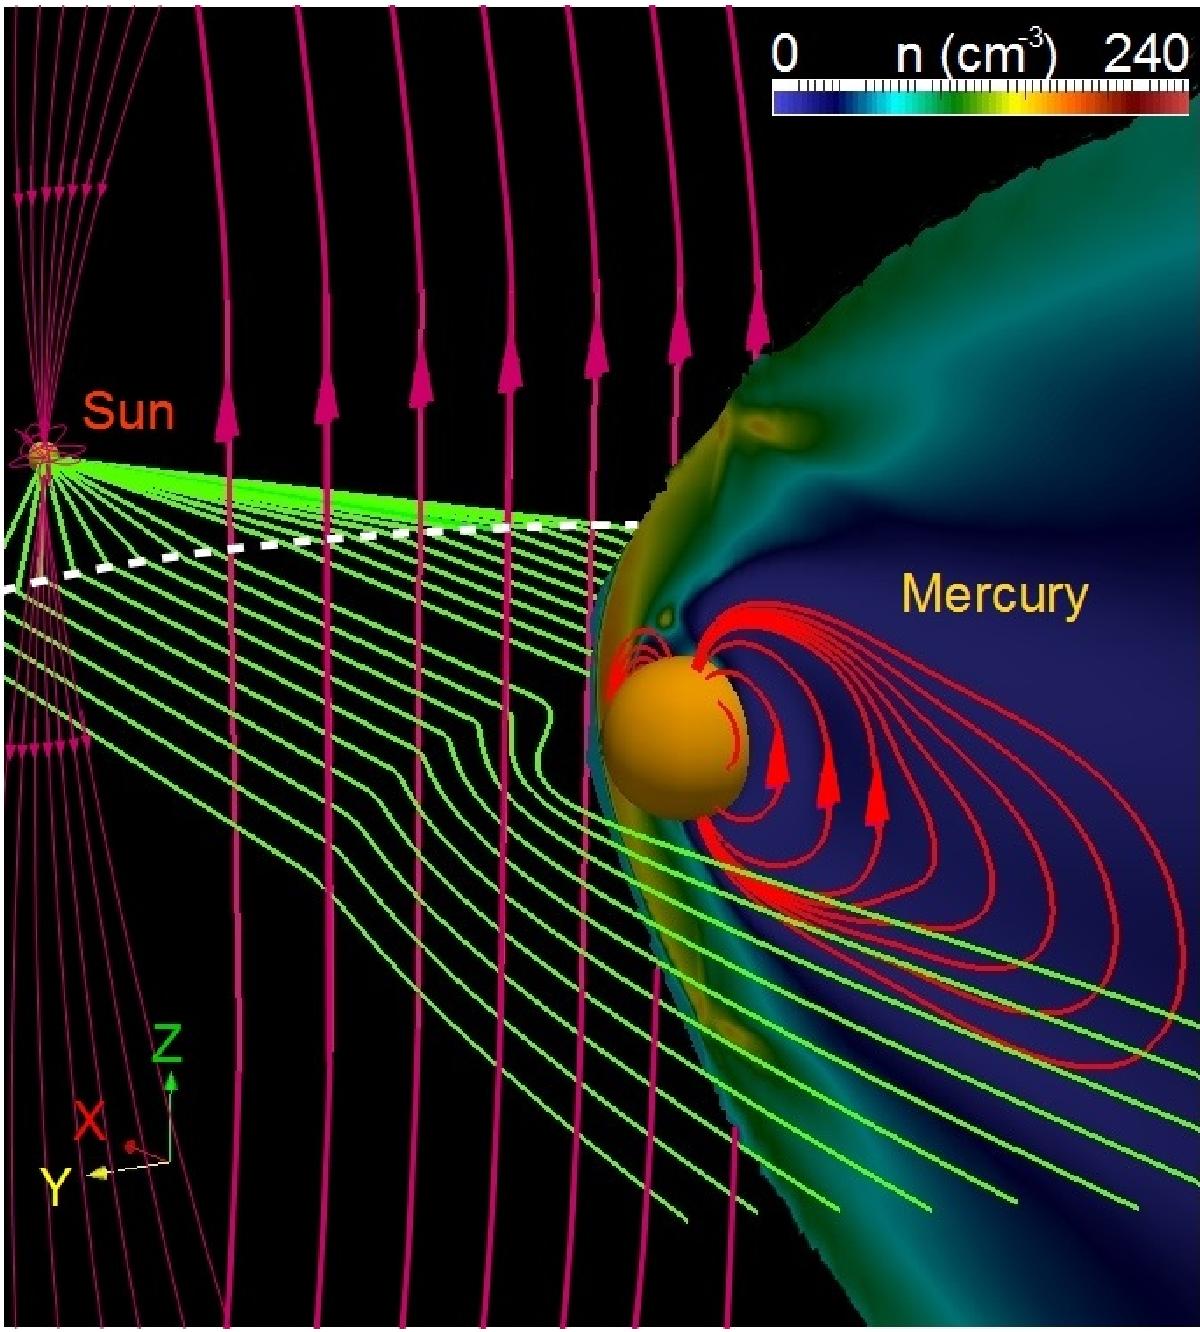
3D view of the system. Density distribution (color scale), field lines of the Hermean magnetic field (red lines), IMF (pink lines) and solar wind stream lines (green lines). The arrows indicate the orientation of the Hermean and interplanetary magnetic fields (case Bz). Dashed white line shows the beginning of the simulation domain.
Current usage metrics show cumulative count of Article Views (full-text article views including HTML views, PDF and ePub downloads, according to the available data) and Abstracts Views on Vision4Press platform.
Data correspond to usage on the plateform after 2015. The current usage metrics is available 48-96 hours after online publication and is updated daily on week days.
Initial download of the metrics may take a while.