Fig. 3
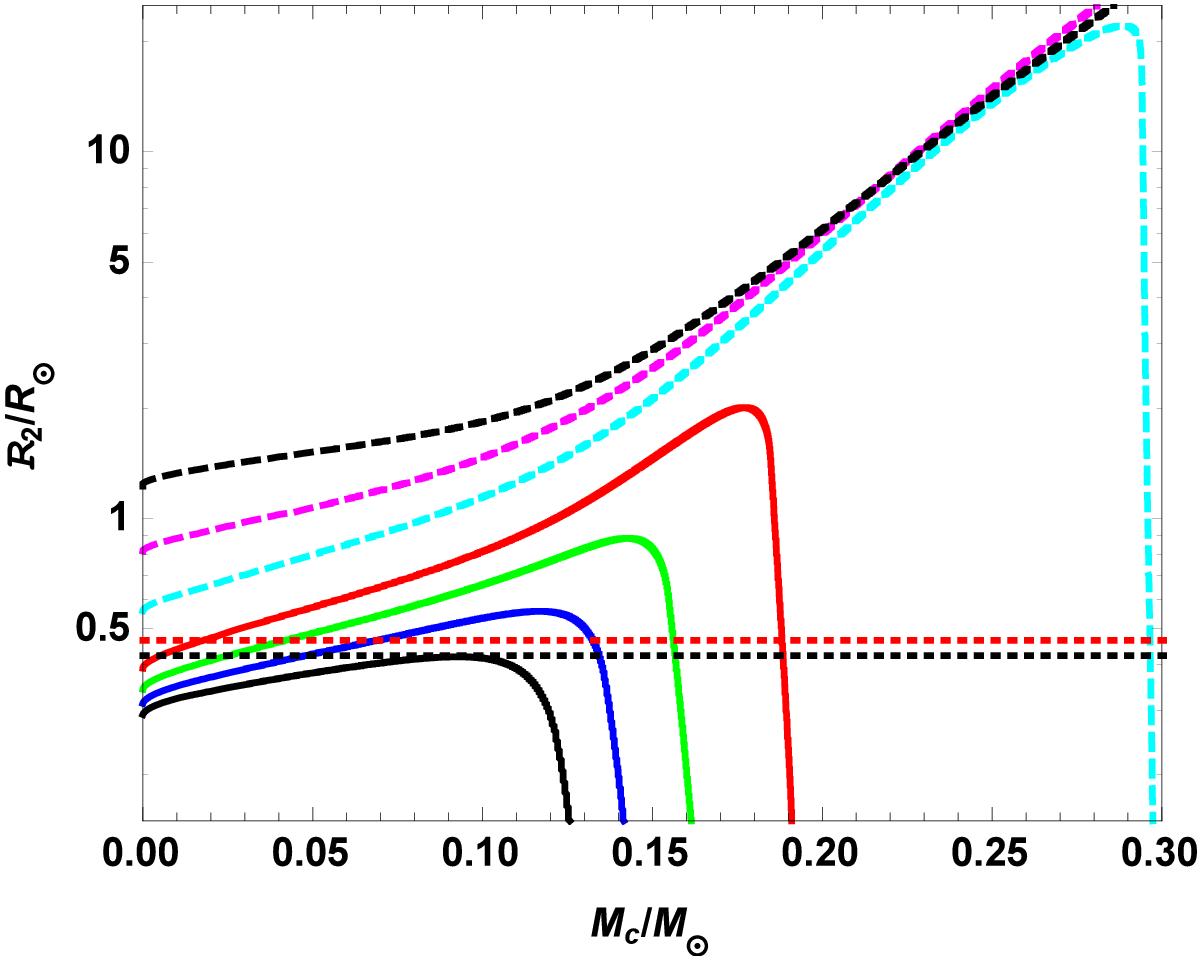
Evolution of partially stripped giants in the Mc−R2 diagram. The total star masses are 0.15, 0.16, 0.175, 0.2, 0.3, 0.5, and 0.9 M⊙ for the solid black, blue, green, and red curves, and dashed cyan, magenta, and black curves, respectively. The evolution proceeds (from left to right) at the constant total mass, during which the H-burning shell is moving outwards. This increases the mass of the He core and decreases the mass of the H-rich envelope. The black and red dotted lines show the radius of the Roche-lobe around the donor (and so, to a good approximation, also the radius of this star) for M2 = 0.15 M⊙ and M2 = 0.2 M⊙, respectively. Possible solutions for the donor in IGR J17451−3022 are given by the intersections between the dotted and the solid lines on the left-hand side of the plot.
Current usage metrics show cumulative count of Article Views (full-text article views including HTML views, PDF and ePub downloads, according to the available data) and Abstracts Views on Vision4Press platform.
Data correspond to usage on the plateform after 2015. The current usage metrics is available 48-96 hours after online publication and is updated daily on week days.
Initial download of the metrics may take a while.