Fig. 6
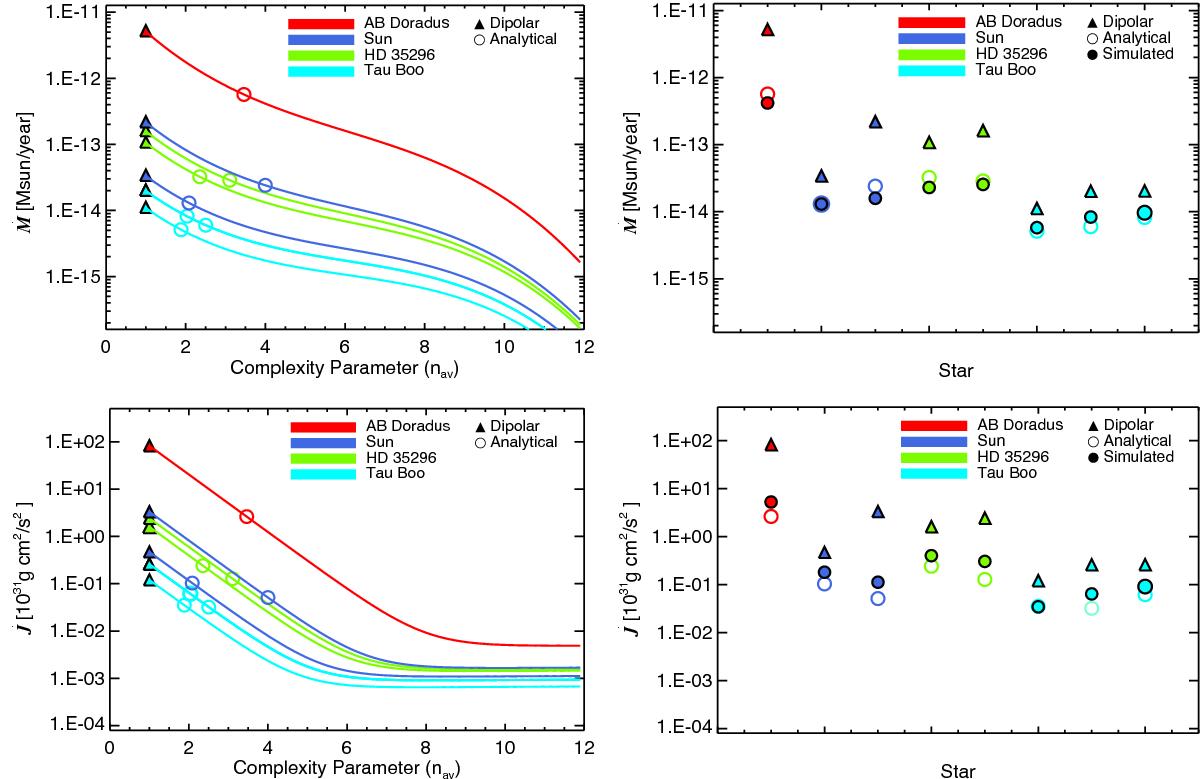
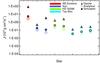
Mass (Ṁtop) and angular momentum (![]() bottom) loss rates for our sample of 8 observed magnetograms (see Fig. 5). The left panels show the analytical estimations as described in Sect. 3.3. Triangles show dipolar morphology of the same total magnetic flux, the scaling laws are shown as lines, and the resulting analytical estimations (for the corresponding nav) are represented by hollow circles. The right panels show the comparison between the equivalent dipolar rates (represented by triangles), the estimated rates (represented by hollow circles), and the results from our simulations (represented by full circles).
bottom) loss rates for our sample of 8 observed magnetograms (see Fig. 5). The left panels show the analytical estimations as described in Sect. 3.3. Triangles show dipolar morphology of the same total magnetic flux, the scaling laws are shown as lines, and the resulting analytical estimations (for the corresponding nav) are represented by hollow circles. The right panels show the comparison between the equivalent dipolar rates (represented by triangles), the estimated rates (represented by hollow circles), and the results from our simulations (represented by full circles).
Current usage metrics show cumulative count of Article Views (full-text article views including HTML views, PDF and ePub downloads, according to the available data) and Abstracts Views on Vision4Press platform.
Data correspond to usage on the plateform after 2015. The current usage metrics is available 48-96 hours after online publication and is updated daily on week days.
Initial download of the metrics may take a while.